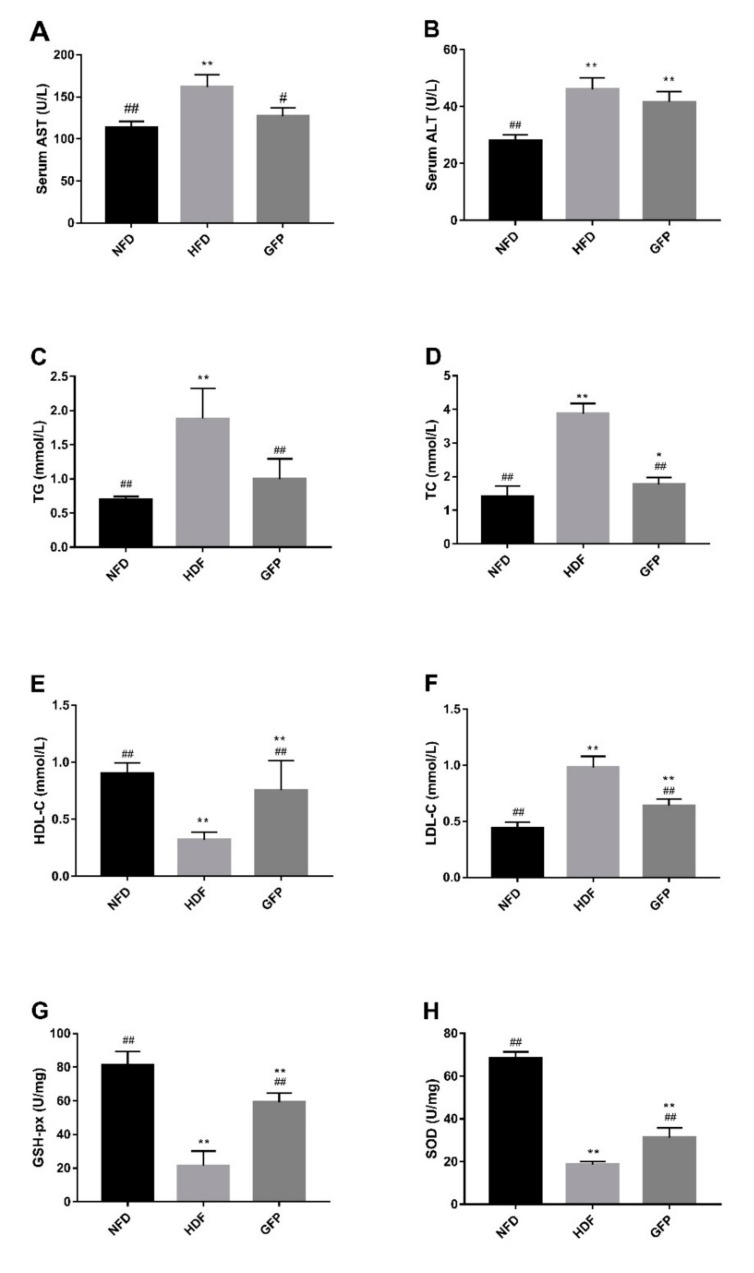
Figure 1.
Effects of GFP on liver protection and lipid levels of non-alcoholic fatty liver disease (NAFLD) rats: (A) serum aspartate transaminase (AST); (B) serum alanine transaminase (ALT); (C) lipid triglycerides (TG); (D) total cholesterol (TC); (E) high-density lipoprotein cholesterol (HDL-C); (F) low-density lipoprotein cholesterol (LDL-C); (G) liver glutathione peroxidase (GSH-px); and (H) liver superoxide dismutase (SOD). Values are presented as the mean ± SD (n = 5). Differences were assessed by ANOVA and are denoted as follows: * p < 0.05 versus the NFD group; # p < 0.05 versus the HFD group; ** p < 0.01 versus the NFD group; and ## p < 0.01 versus the HFD group.

