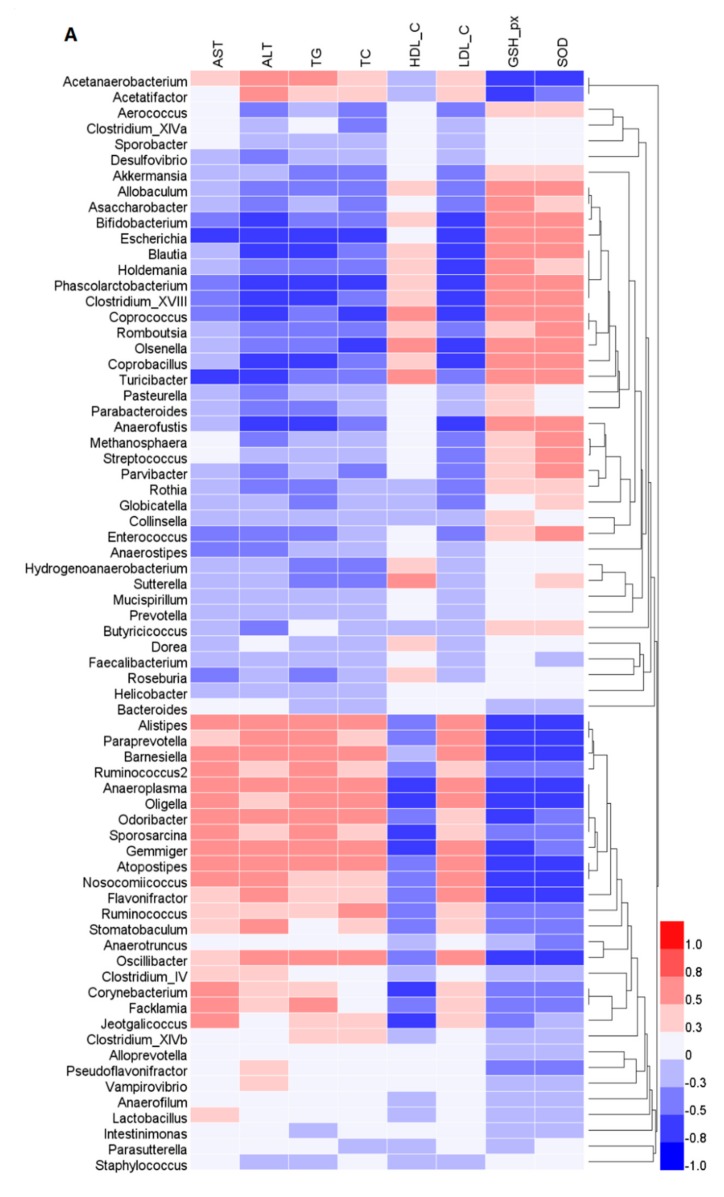
Figure 6.
Spearman’s correlations between the cecal microbiota and biochemical parameters measured in this study. (A) Heatmap of Spearman’s correlation values showing the significant relationships between cecal microbiota and biochemical parameters. The color intensity represents the degree of association between cecal microbiota and biochemical parameters. (B) Visualization of the correlation network according to the significant correlations among the cecal microbiota and biochemical parameters. The significant edges were drawn in the network using the Spearman’s correlation test (|r| > 0.7). Each node represents a gut microbiota genus (blue nodes) and parameters (red nodes). The red and blue lines represent positive and negative correlations, respectively. In addition, the width of the lines indicates the strength of the correlation.


