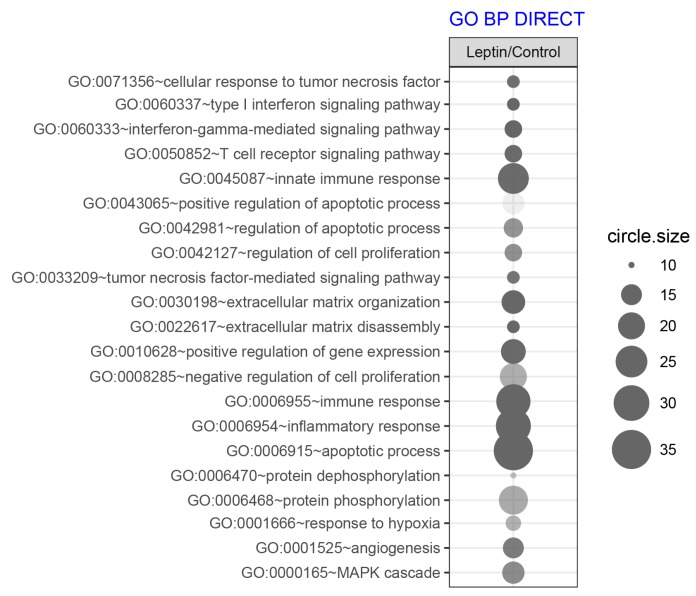
Figure 3.
Bubble plot of overrepresented gene sets in DAVID GO BP DIRECT annotations database obtained from comparisons in gene expression profiles between LEP-treated LNCaP vs. control. The graph show only the GO groups above the established cut-off criteria (p with correction <0.05, a minimal number of genes per group >10). The size of each bubble reflects the number of differentially expressed genes, assigned to the GO BP terms. Transparency of the bubbles displays p-value (more transparent—closer to the border of p = 0.05).

