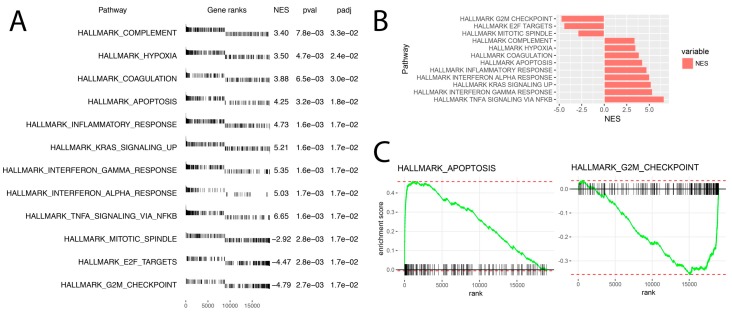
Figure 4.
Gene set enrichment analysis using Hallmark gene sets. (A) List of significantly enrichment gene sets with appropriate gene ranks, normalized enrichment score (NES), p values (pval) and p values after FDR correction (padj). (B) Bar chart of normalized enrichment score (NES) values for previously selected gene sets. (C) Enrichment plot of “Hallmark apoptosis” and “Hallmark G2M checkpoint” gene sets.

