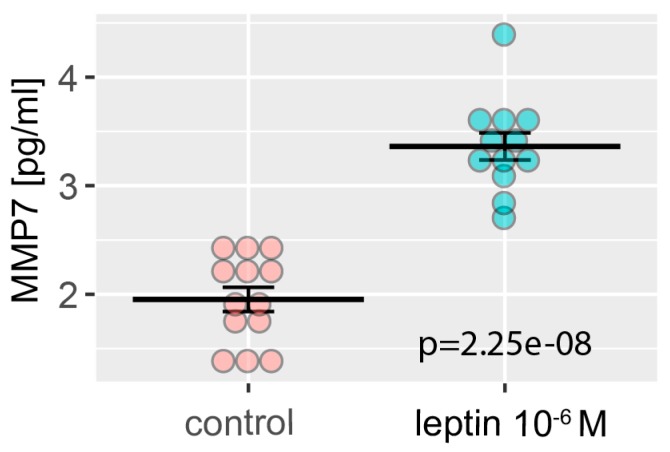
Figure 10.
Level of MMP7 in LNCaP cells medium with (blue) or without (red) LEP at 1 × 10⁻⁶ M concentration. Levels of MMP7 were measured by ELISA, n = 12 (10−6 M) and n = 13 (control). Results are presented as means ± SEM. Each dot represents an individual sample. Statistical comparison by Student’s t-test: p value shown on the graph.

