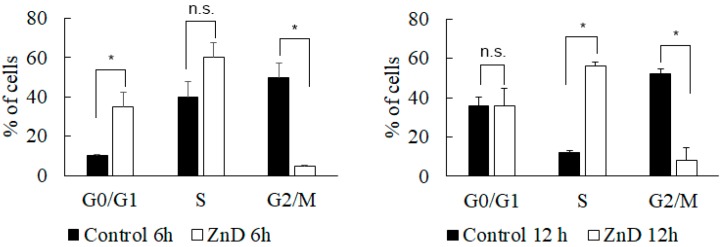
Figure 3.
Cell cycle evaluation. Percentage of HCT116 cells in the different phases of the cell cycle after incubation for 6 and 12 h in the presence (0.217 µM, IC50 at 48 h) or absence (water) of the ZnD compound. PI fluorescent levels were determined by flow cytometry. The results are expressed as the mean ± SEM percentage from three independent experiments. * p < 0.05 compared to control. n.s.—no statistical difference.

