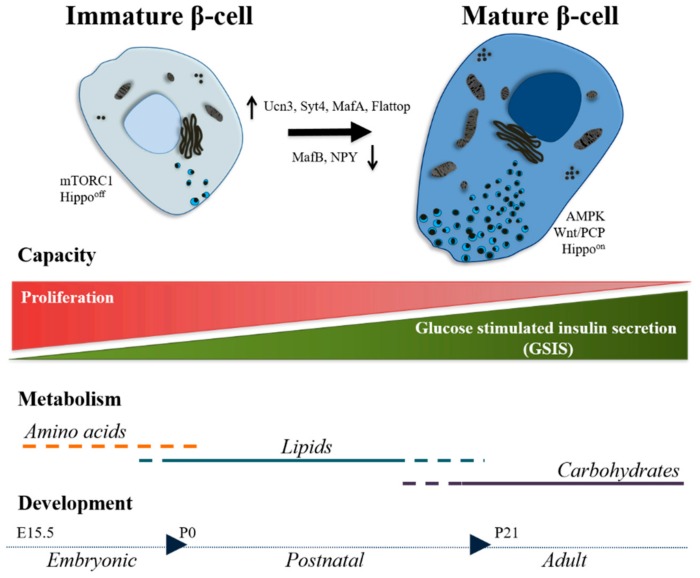
Figure 2.
β-cell maturation process. Simplified representation of the complex group of events leading to the β-cell maturation in rodents. In the top part of the figure, β-cells in their immature ad mature stages, characterized by key signaling pathways. Between the two cells, the prominent TFs and markers that are differentially regulated in the maturation process are shown. Below the two most significant capacities are mentioned, proliferation for immature β-cells and GSIS for mature β-cells. Following, the type of metabolisms affecting the maturation stages are mentioned. At the bottom, the timeline of the β-cell maturation process is indicated.

