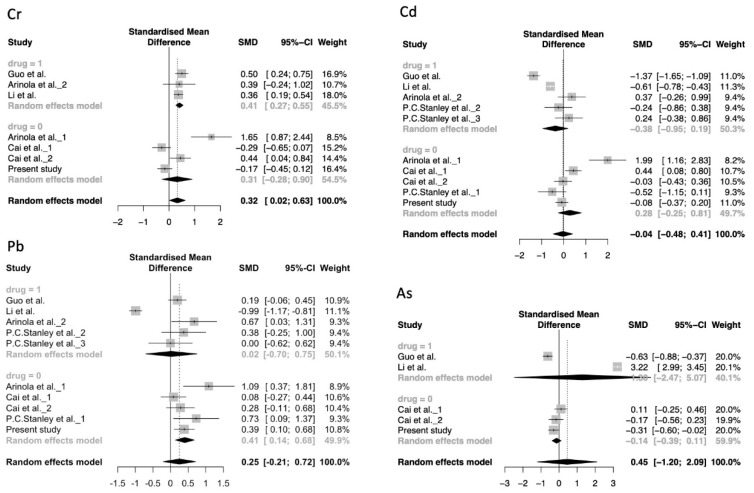
Figure 2.
Forest plot of overall meta-analysis and subgroup analysis of the association between the concentration of each THM and schizophrenia. Overall pooled prevalence was calculated by random-effects module. drug = 1, patients with schizophrenia were treated with antipsychotic drugs. drug = 0, patients with schizophrenia were not treated with antipsychotic drugs. Horizontal bars show 95% CIs.

