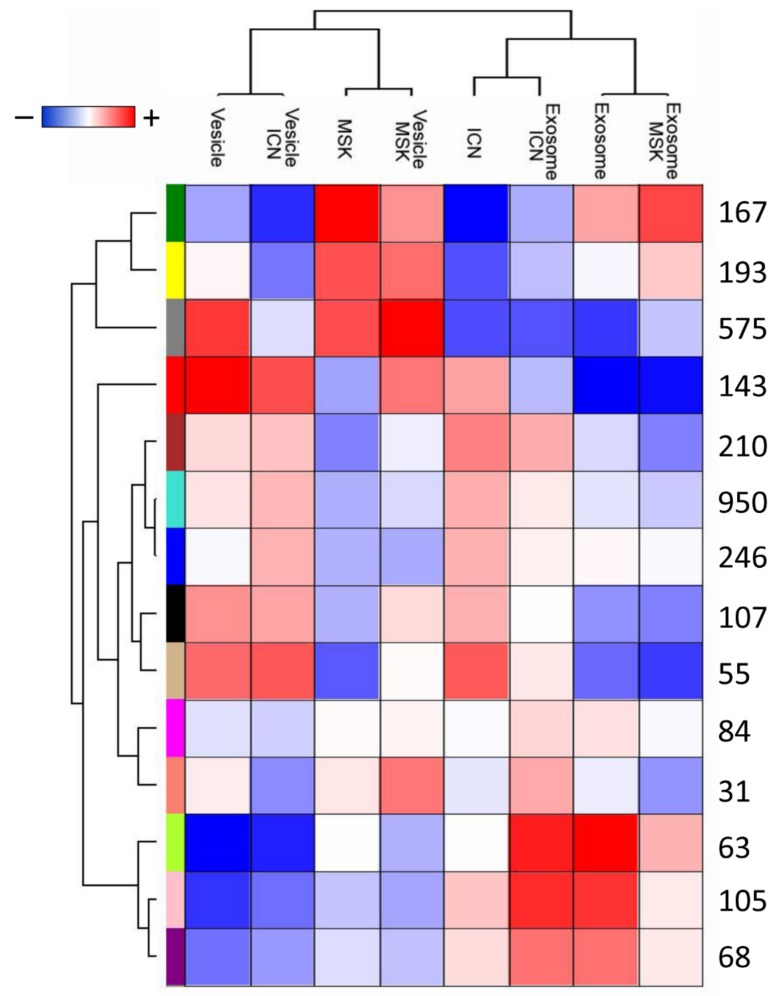
Figure 2.
Module identification and relationships with clinical traits. Heat map of the relationships between module eigengenes and the trait indicator of each sample. The grade of the relationship ranges from −1 (blue) to 1 (red), where blue represents a perfect negative correlation and red a perfect positive correlation.

