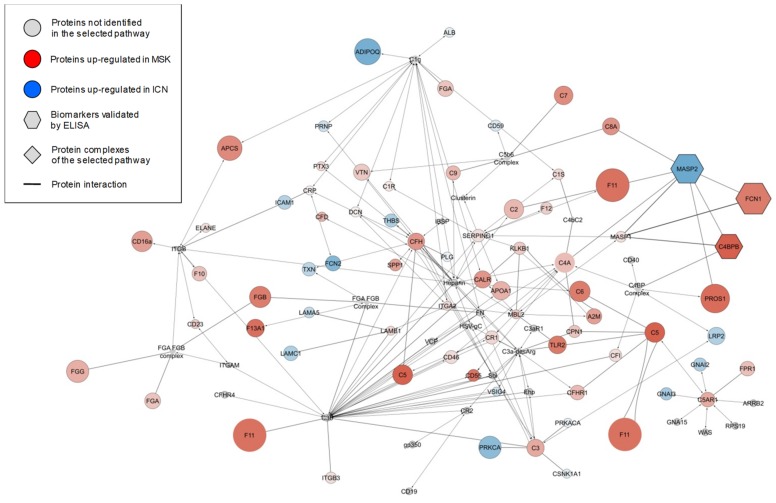
Figure 5.
Complement lectin pathway activation. The diagram shows the zoom-in of the immune system enrichment results mapped as a network. Nodes and edges represent, respectively, the proteins and their interaction in the pathway of complement lectin activation. The color intensity of each protein (node) indicates the fold change increment in the urinary exosome fraction of MSK (red) versus ICN (blue) patients and the node size is representative of their p-value. The gray nodes represent unidentified proteins (circle) and protein complexes (diamonds) in the lectin pathway. The hexagons indicate the three proteins that maximize the discrimination between ICN and MSK samples as highlighted by the combined use of univariate/multivariate statistical analysis and machine learning algorithms.

