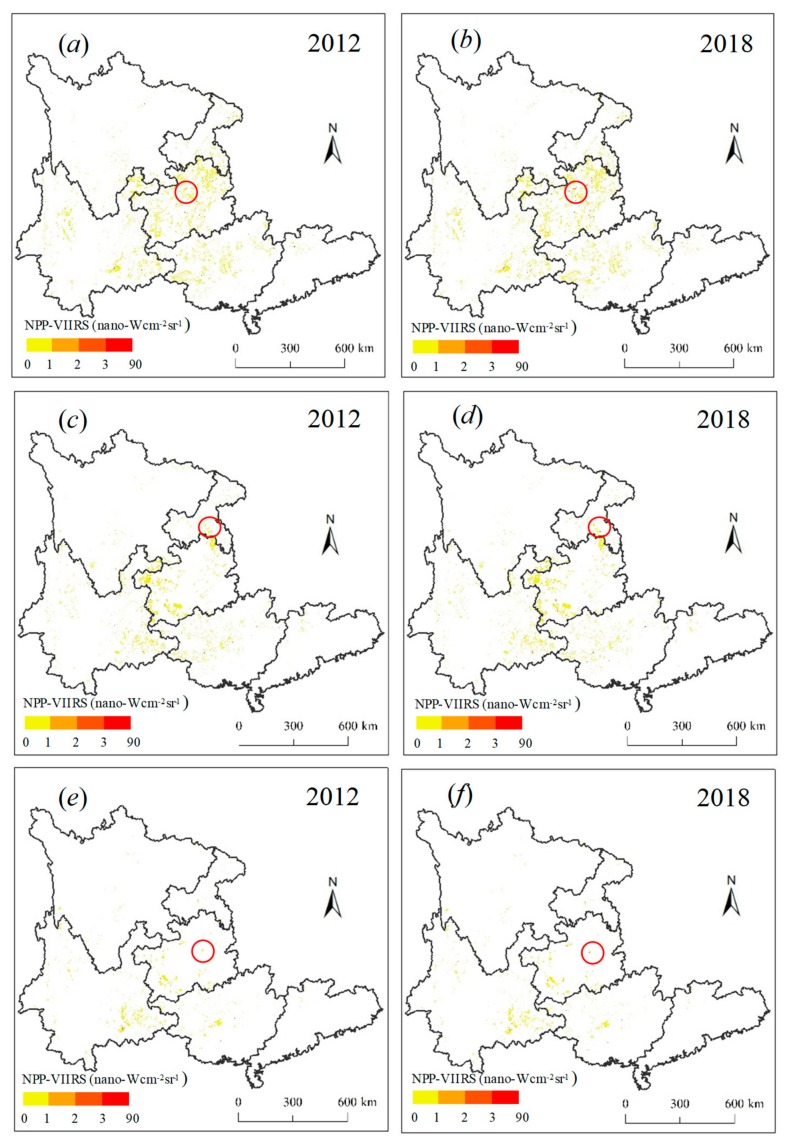
Figure 4.
The corrected National Polar-orbiting Partnership (NPP) Visible Infrared Imaging Radiometer Suite (VIIRS) data related to karst rocky desertification from 2012 to 2018. Note: (a,b) The corrected NPP-VIIIRS data related to the L areas; (c,d) The corrected NPP-VIIIRS data related to the M areas; (e,f) The corrected NPP-VIIIRS data related to the S areas. L represents slight karst rocky desertification; M represents moderate karst rocky desertification; and S represents severe karst rocky desertification.

