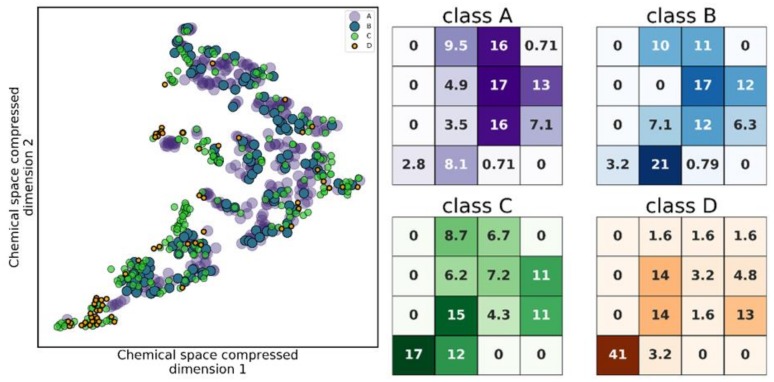
Figure 4.
(Left) Chemical space of the four half maximal inhibitory concentration (IC50) value classes, where an uneven distribution of classes can be seen. (Right) Density of data points per class, represented as % points from a given class found in a specific region of the plot, with respect to the total amount of points from that class. Class A preferentially populates the top-right quadrant of the plot, while C and D populate the lower-left corner.

