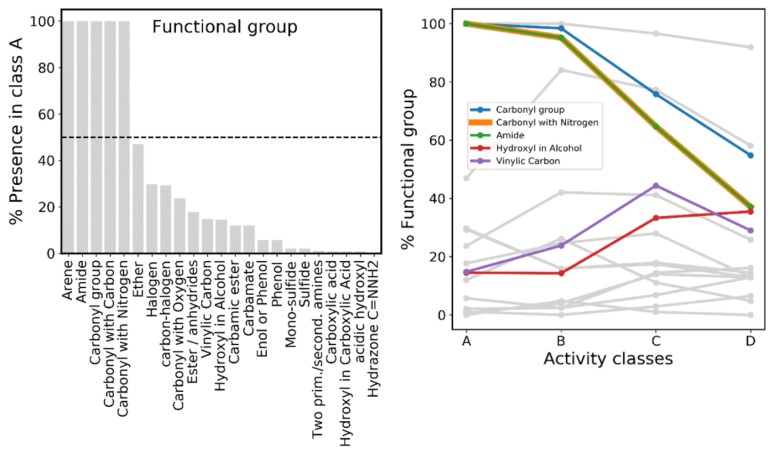
Figure 16.
Frequency of common functional groups defined by Daylight SMARTS among proteasome inhibitors. (Left) Frequency (%) of functional groups in class A, sorted by descending order of percentage. Dotted line indicates 50% frequency. (Right) Functional groups highlighted according their (inverse or direct) correlation with activity. The gray lines in the background are the additional functional groups defined in the left plot, and correspond to groups with lower correlation with activity.

