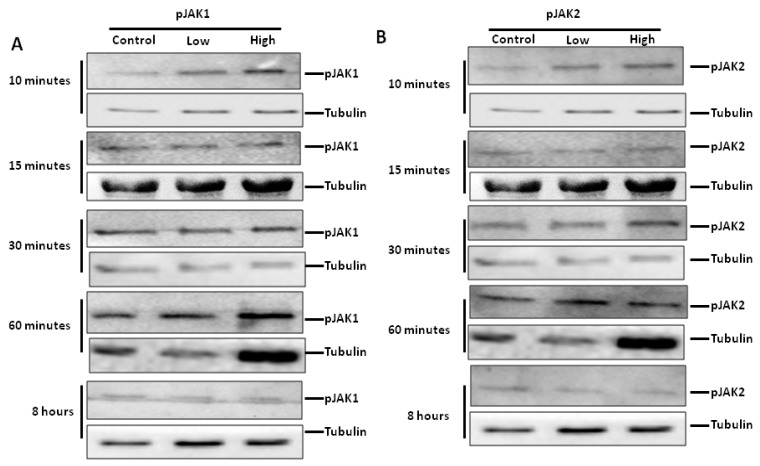
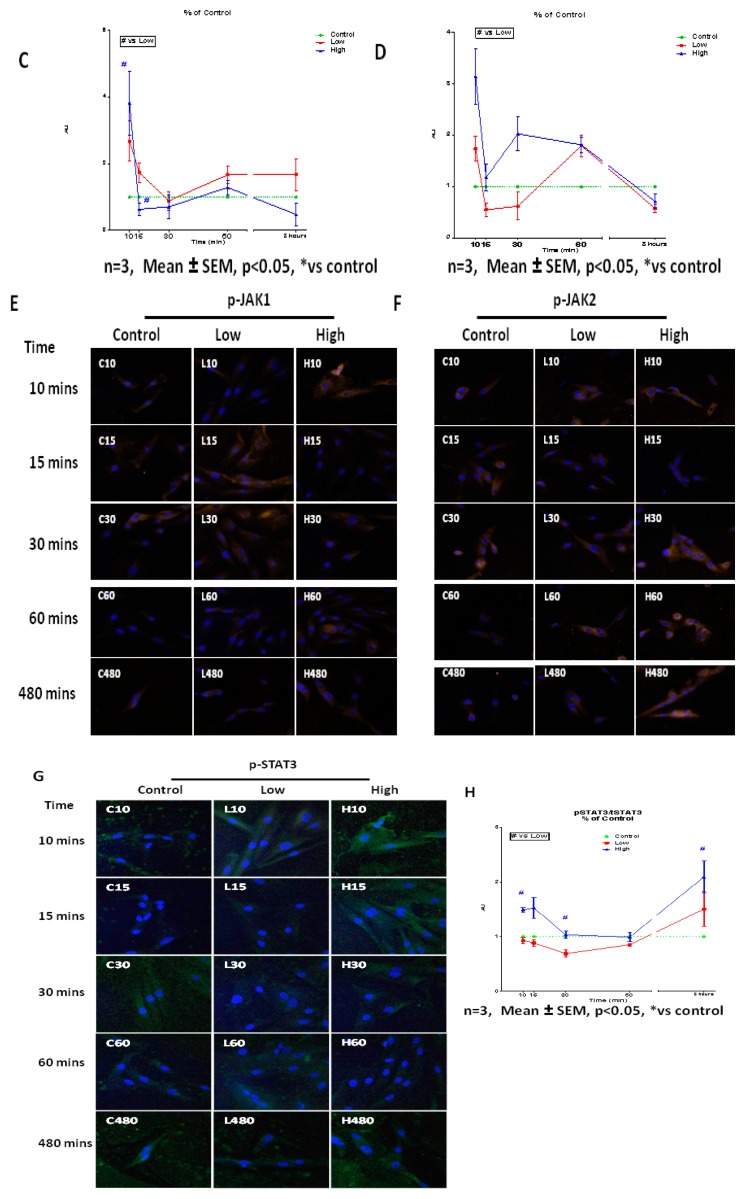
Figure 9.
Effect of low and high IL-6 concentrations on JAK1 and JAK2 phosphorylation in PHMs. (A) Effect of low and high IL-6 concentration on JAK1 phosphorylation over 8 h. (B) Effect of low and high IL-6 concentration on JAK2 phosphorylation over 8 h. (C) Quantification of p-JAK1 as shown in (A). (D) Quantification of p-JAK2 as shown in (B). (E) Immunofluorescence staining for p-JAK1 after treatment of PHMs with low and high IL-6 concentration over 8 h. (F) Immunofluorescence staining for p-JAK2 after treatment of PHMs with low and high IL-6 concentration over 8 h. (G) Immunofluorescence staining for p-STAT3 after treatment of PHMs with low and high IL-6 concentration over 8 h (H) Quantification of p-STAT3 levels as shown in (G). The experiment was repeated three times. All immunofluorescence images were taken at 100× magnification. Results are presented as mean ± standard error of the mean (S.E.M). Statistical analysis: ANOVA and Bonferroni post hoc test. * p < 0.05; ** p < 0.01; *** p < 0.001.


