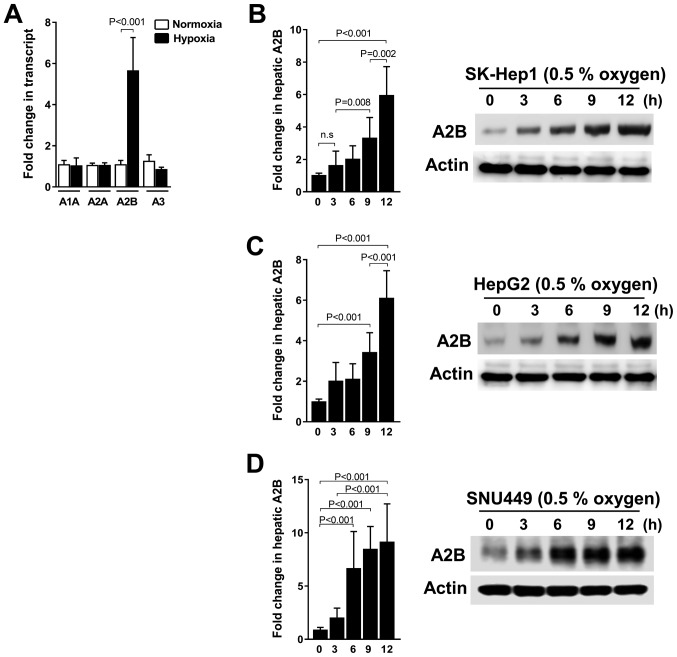
Figure 1.
Adenosine receptor isoform expression profiles in liver cancer cell lines and A2B induction following hypoxic growth of representative liver cancer cell lines. (A) Transcript expression profiles of adenosine receptor isoforms, including A1, A2A, A2B and A3, in liver cancer cell lines (SK-Hep1, HepG2 and SNU-449). (B) Transcriptional and protein expressions of A2B in liver cancer cell lines (B) SK-HEP1, (C) HepG2 the hepatoblastoma cell line and (D) SNU-449 grown under hypoxic (0.5% O2) or normal conditions. Transcriptional expression patterns and levels were detected using reverse transcription-quantitative PCR. The results were analyzed relative to GAPDH and according to fold changes relative to the control. For western blot analysis, actin was used as a loading control. Data are presented as the mean ± standard deviation.

