Figure 1.
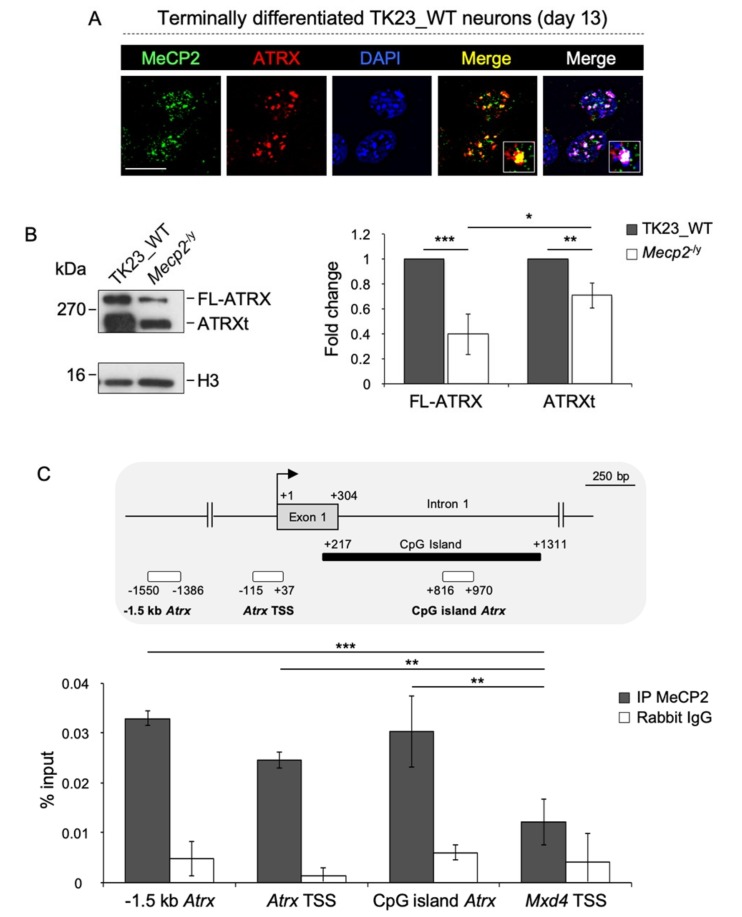
MeCP2 co-localizes with ATRX at chromocenters and promotes its expression in terminally differentiated neurons. (A) Double immunofluorescence performed in terminally differentiated TK23_WT neurons by using anti-MeCP2 (green) and anti-ATRX (39f, red) antibodies. Blue, DAPI counterstaining of nuclei to highlight chromocenters. Merged images show MeCP2/ATRX signals and MeCP2/ATRX/DAPI signals. Insets show magnifications of a chromocenter. Scale bar, 15 μm. (B) Left: Representative western blot for expression of FL-ATRX and ATRXt in nuclear protein extracts of differentiated TK23_WT and Mecp2-/y neurons using anti-ATRX antibody (39f). Total H3 histone was used as normalizator. Right: Quantification of FL-ATRX and ATRXt expression. Data are mean fold changes ± standard deviation for FL-ATRX/H3 and ATRXt/H3 ratios, with Mecp2-/y neurons normalized to TK23_WT neurons, from four independent experiments. * p < 0.05; ** p < 0.01; *** p < 0.001 (two-tailed Student’s t-test). (C) Top: Schematic representation of part of murine Atrx gene. White rectangles indicate regions analyzed by chromatin immunoprecipitation. Black bar indicates the CpG island. Grey box represents the exon 1. The transcriptional start site (TSS) is shown by an arrow. Numbers indicate the position with respect to the TSS. Bottom: Quantification of chromatin immunoprecipitation for MeCP2 binding to the Atrx promoter in terminally differentiated TK23_WT neurons using the anti-MeCP2 antibody (IP MeCP2) or normal rabbit immunoglobulin G (Rabbit IgG, negative control). The TSS (from –115 to +37 with respect to the TSS), a region located at –1.5 kb from the TSS (from –1550 to –1386 with respect to the TSS) and the CpG island spanning the exon 1 (from +816 to +970 with respect to the TSS) of Atrx gene have been analyzed, as illustrated at the top of the figure. Max dimerization protein 4 (Mxd4) TSS was used as negative control genomic region. Data obtained by quantitative PCR (qPCR) are expressed as enrichment of chromatin-associated DNA fragments immunoprecipitated by anti-MeCP2 antibody compared with input (% input) and represent mean ± standard deviation for two biological replicates, with each amplified twice. *** p < 0.001; ** p < 0.01 (one-tailed Student’s t-test).

