Figure 4.
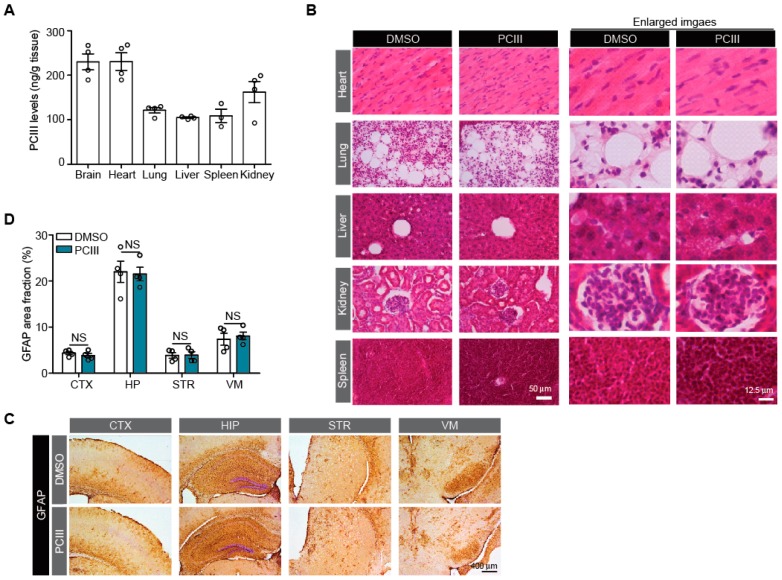
Tissue distribution and potential toxicity of PCIII in vivo. (A) Quantification of PCIII levels in each indicated tissue (ng/g tissue weight) determined by UHPLC (n = 3 mice for spleen and 4 mice for other tissues) (B) Tissue toxicity profiling of PCIII with H&E staining of the indicated tissue sections from mice treated with high dose PCIII (i.p., 10 mg/kg/day) or DMSO. (C) Neuropathological assessment of potential neuroinflammation with GFAP immunohistochemistry for the indicated brain sections from mice treated with high dose PCIII (i.p., 10 mg/kg/day) or DMSO. Scale bar = 400 μm (D) Quantification of % area fraction occupied by GFAP positive signals in the IHC images of each brain sections of mice treated with high dose PCIII or DMSO as control (n = 4 mice per group). The quantified data are expressed as means ± SEMs. Statistical significance was determined by unpaired two tailed student t-test test, NS, nonsignificant.

