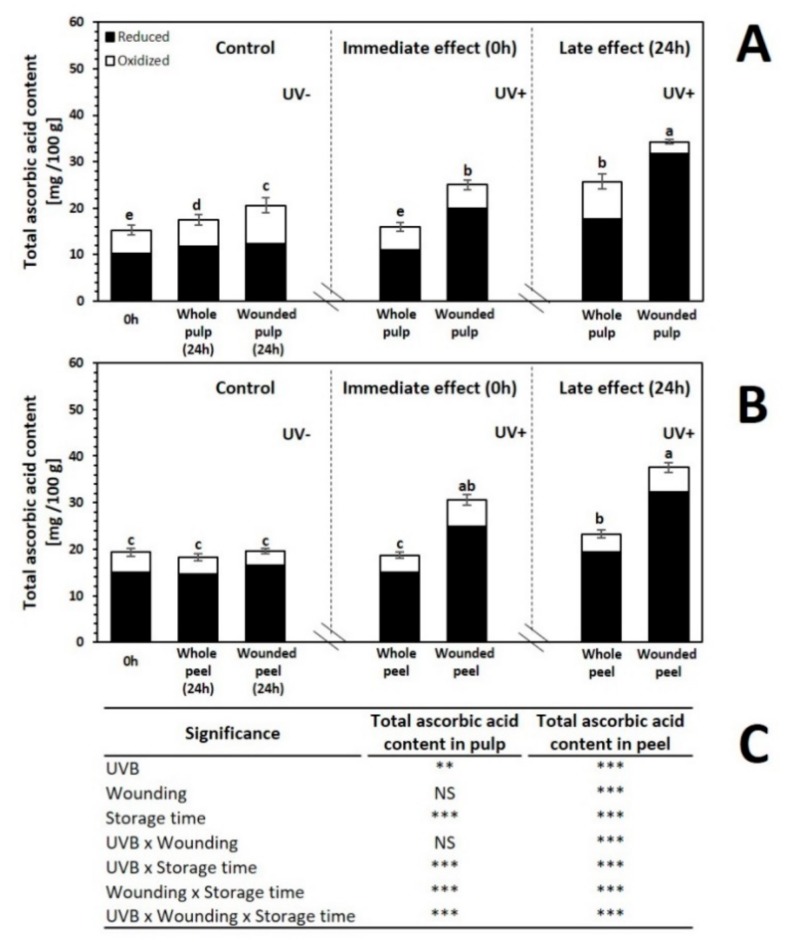
Figure 3.
Concentration of ascorbic acid before and after storage (24 h at 16 °C) of whole and wounded red prickly pear (A) pulp and (B) peel treated with UVB light (6.4 W·m−2) for 0 and 15 min. (C) Full factorial analyses of variance showing the main effects and interactions of the variables evaluated. Bars are means of five replicates ± standard error. Different letters among bars indicate statistical difference between treatments using the least significant difference (LSD) test (p < 0.05). Asterisks indicate that main effects and interactions are significantly different by analyses of variance (ANOVA). NS—non significant, * p < 0.05, ** p < 0.01, *** p < 0.001. Results are expressed as mg equivalents of ascorbic acid per 100 g of sample in dry weight basis.

