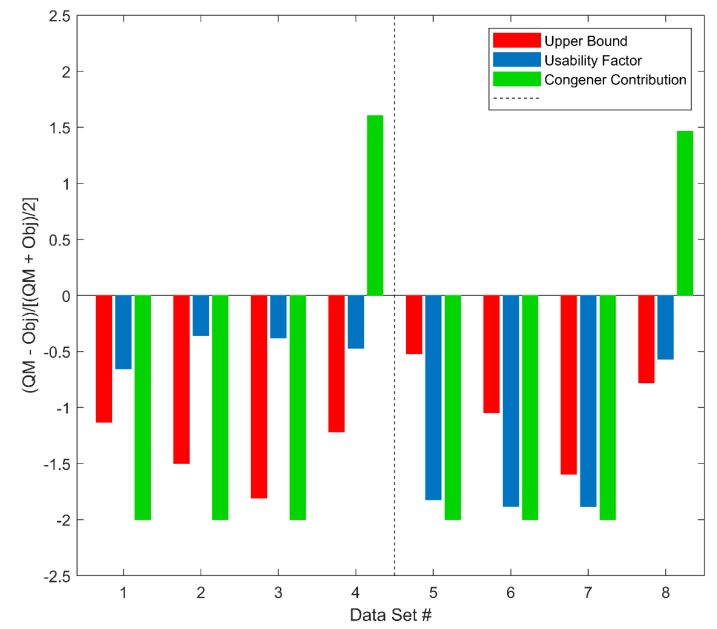
Figure 7.
Difference between quality metrics and their objectives for upper bound (red bars), usability factor (blue bars), and congener contribution (green bars) are shown for four pairs of Target Data (left panel) and Duplicate Data (right panel). The x axis gives the order of the eight data sets. The eight datasets are from the whole milk tested on 29 June 2018. Datasets 1 and 5 are the detections of dioxins and furans; 2 and 6 are detections of mono PCBs; 3 and 7 are detections of marker PCBs, and 4 and 8 are detections of PBDEs. #: Data Set.

