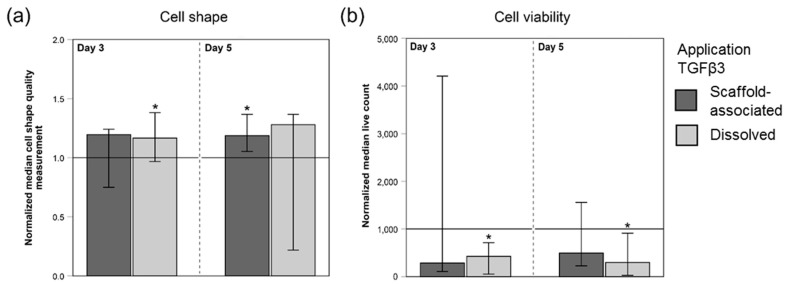
Figure 3.
Quantitative image analysis results of LIVE/DEAD®-stained, MSC-seeded tendon scaffolds. Values of the cell shape measurements (a) and of the numbers of viable cells (b) were normalized to the corresponding internal controls (w/o TGFβ3; indicated by the horizontal line intersecting the x-axis at 1.0). Higher values of the cell shape measurement in (a) correspond to more elongated cells. MSC-seeded tendon scaffolds were either directly loaded with TGFβ3 (scaffold-associated) or TGFβ3 was supplemented via the cell culture medium (dissolved). The total number of scaffolds within each group was 42 (n = 42). Bars represent the normalized median values and error bars the 95% confidence interval; one extreme outlier value was removed (scaffold-bound TGFβ3 group in (b), day 3) before plotting the graph; * illustrates significant differences compared to the respective untreated control group (w/o TGFβ3) (p < 0.05).

