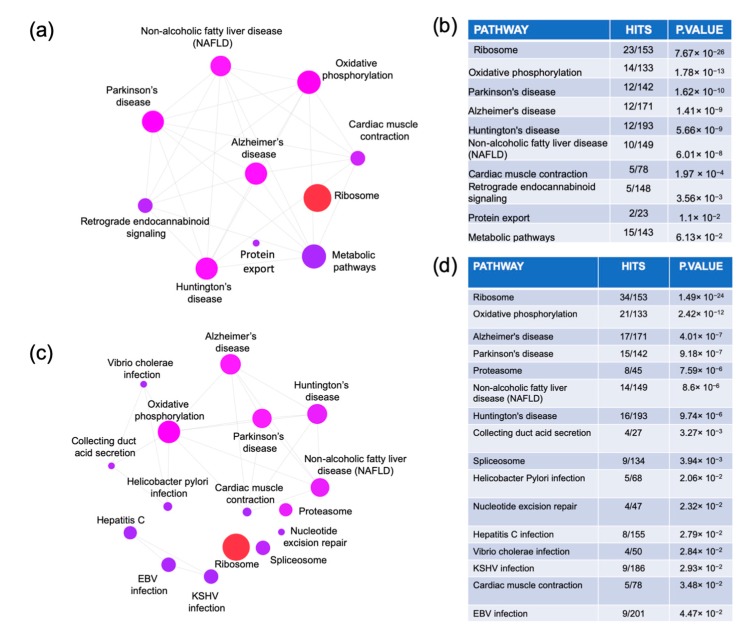
Figure 3.
Pathway analysis. The genes that were commonly dysregulated in the MCI arrays (a,b) and in at least two of the ADD arrays (c,d) were obtained from the Venn diagram analysis. The genes lists were uploaded to https://www.networkanalyst.ca/NetworkAnalyst/faces/home.xhtml where an enrichment network analysis was performed using the Kyoto Encyclopedia of Genes and Genome (KEGG) database.

