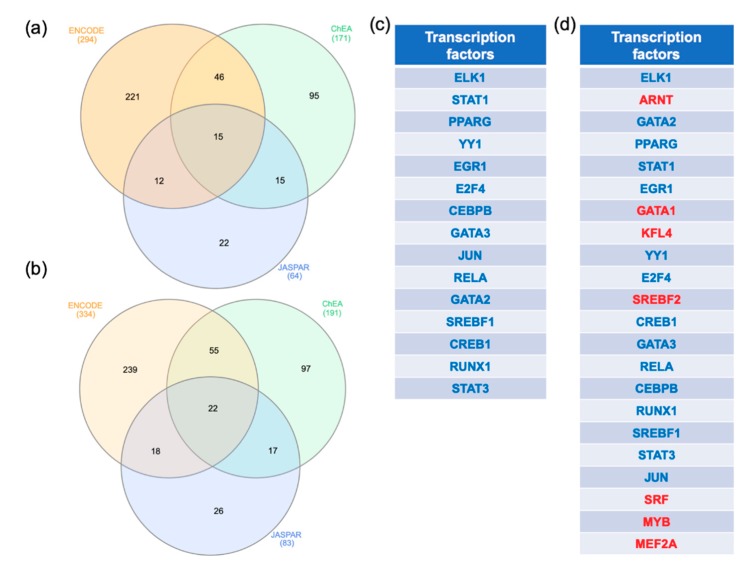
Figure 4.
Transcription factors analysis. The genes commonly dysregulated in the MCI arrays and in at least two out of the ADD arrays were obtained using Venn diagram analysis. The gene lists were uploaded to https://www.networkanalyst.ca/NetworkAnalyst/faces/home.xhtml. The gene-transcription factor interaction network was performed with ENCODE, ChEA, and JASPAR. A Venn diagram analysis was performed to identify the transcription factors identified by the three methods. (a,b) represent the results of the Venn diagram analysis performed with MCI and ADD genes, respectively. The transcription factors interacting with the MCI and ADD genes were listed in (c,d), respectively. Transcription factors in blue are common in MCI and ADD analysis whereas the transcription factors in red were specific to ADD regulation.

