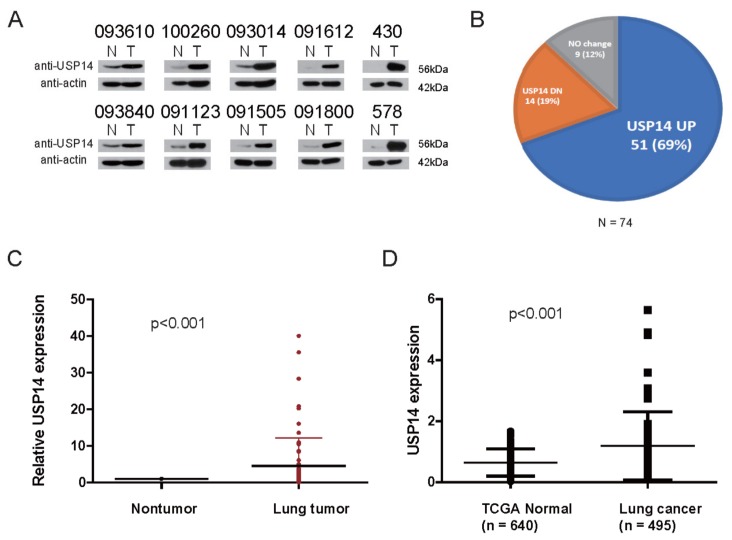
Figure 1.
USP14 expression level in lung cancer tissues. (A) Representative immunoblot for USP14 and β-actin in 74 paired lung cancer tissues and their adjacent nontumor lung tissues (N, nontumorous, T, cancer tissue), (B) pie chart of USP14 expression using immunoblot analysis in 74 paired lung cancer tissues and nontumor tissues. β-Actin expression was used as an internal control, (C) USP14 expression levels in 74 lung cancer cases. P-values represent probabilities for USP14 expression levels between variable subgroups determined with two-sided Fischer’s exact test (tumor node metastasis), (D) expression levels of the USP14 gene in healthy individuals (Normal, n = 640) and patients with lung cancer (Tumor, n = 495) from the TCGA LUAD database. The box plot represents the mean expression of USP14 (±SD), and the horizontal line indicates the median value.

