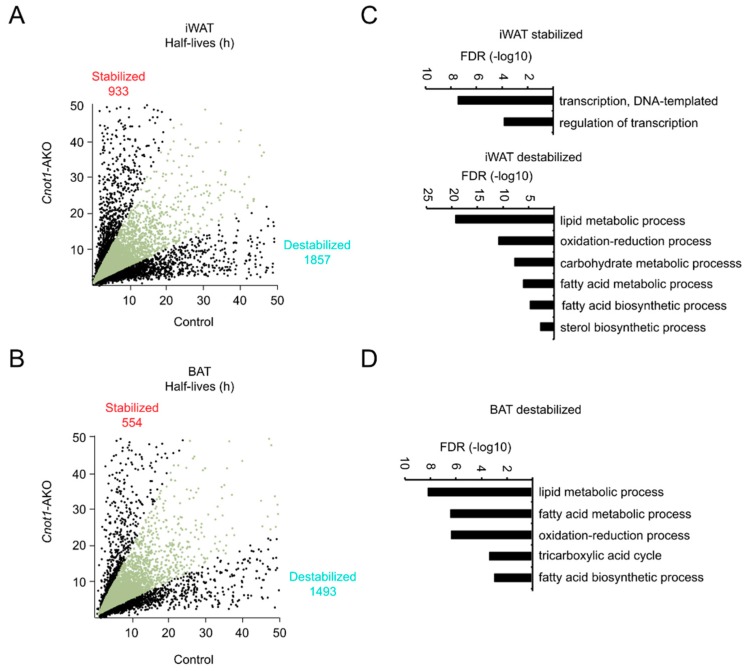
Figure 5.
mRNA destabilization is more prominent than mRNA stabilization in adipose tissues of Cnot1-AKO mice. (A,B) Scatter plots of mRNA half-lives in iWAT (A) and BAT (B) of 12-week-old control and Cnot1-AKO mice (n = 4). Black dots represent mRNAs with half-lives more than two-fold longer or shorter in Cnot1-AKO mice than in controls. (C,D) GO enrichment analysis of genes that were stabilized (half-life Cnot1-AKO/control ratio >2.0) or destabilized (half-life Cnot1-AKO/control ratio <0.5) in iWAT (C) and BAT (D) of 12-week-old Cnot1-AKO mice. Bar charts of the BP GO terms (at most six) ranked by FDR (<0.05) are shown. Note that no significant enrichment of GO terms occurred in stabilized mRNAs in BAT. Gene lists included in each GO term are summarized in Supplementary Tables S3 and S4.

