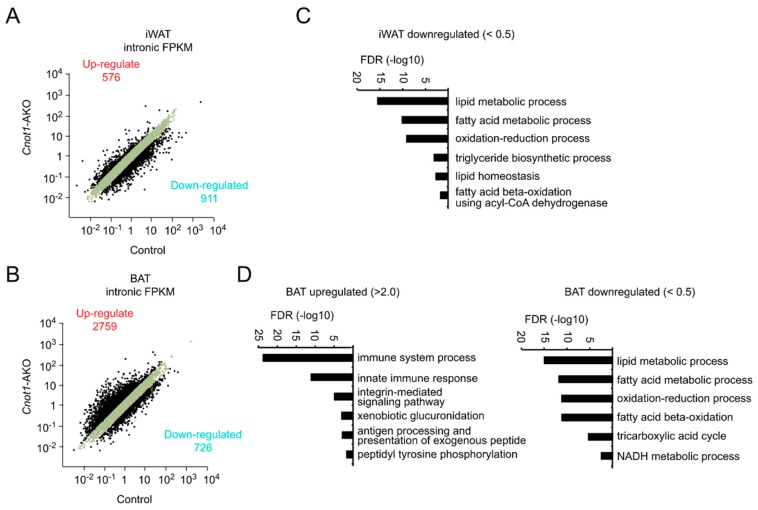
Figure 6.
Changes in pre-mRNA abundances are responsible for gene expression differences between control and Cnot1-AKO mice. (A,B) Scatter plots of intronic fragments per kilobase of exon per million mapped sequence reads (FPKMs) in iWAT (A) and BAT (B) of 12-week-old control and Cnot1-AKO mice (n = 4). Black dots represent pre-mRNAs whose expression differed more than two-fold in Cnot1-AKO mice compared to controls. (C,D) GO enrichment analysis of genes showing intronic FPKMs that increased or decreased more than two-fold in iWAT (C) and BAT (D) of 12-week-old Cnot1-AKO mice. Bar charts of the BP GO terms (at most six) ranked by FDR (<0.05) are shown. Note that no significant enrichment of the BP GO terms occurred for increased pre-mRNAs in iWAT. Gene lists included in each GO term are summarized in Supplementary Tables S5 and S6.

