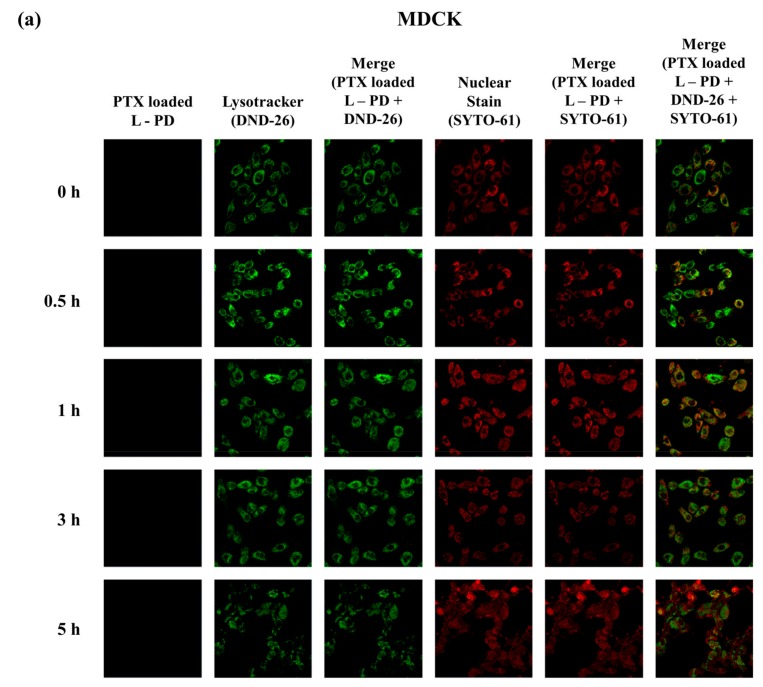
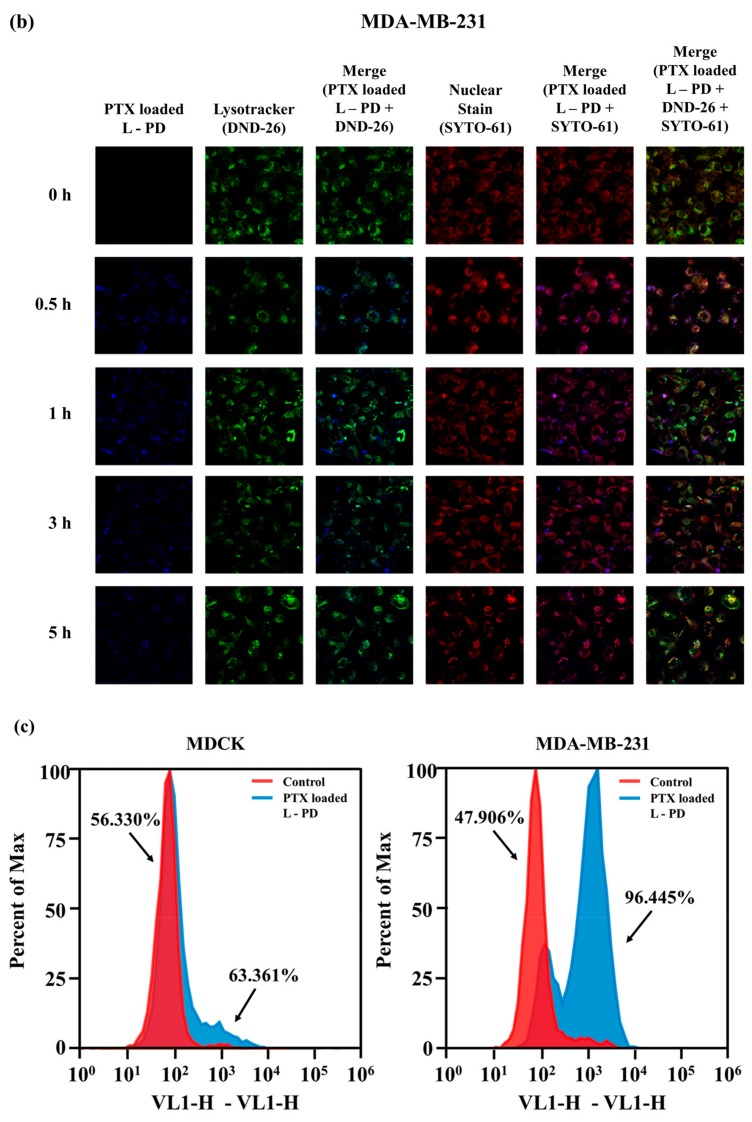
Figure 5.
Confocal images of (a) MDCK and (b) MDA-MB-231 treated with PTX loaded L-PD at different incubation times (0 h, 0.5 h, 1 h, 3 h, and 5 h) stained with a Lysotracker (green) and SYTO 61 (red). (c) Flow cytometric (FACS) analysis of in vitro quantitative fluorescence behavior of MDCK and MDA-MB-231 after treatment without (control) and with PTX loaded L-PD. (Scale Bar: 40 µm).


