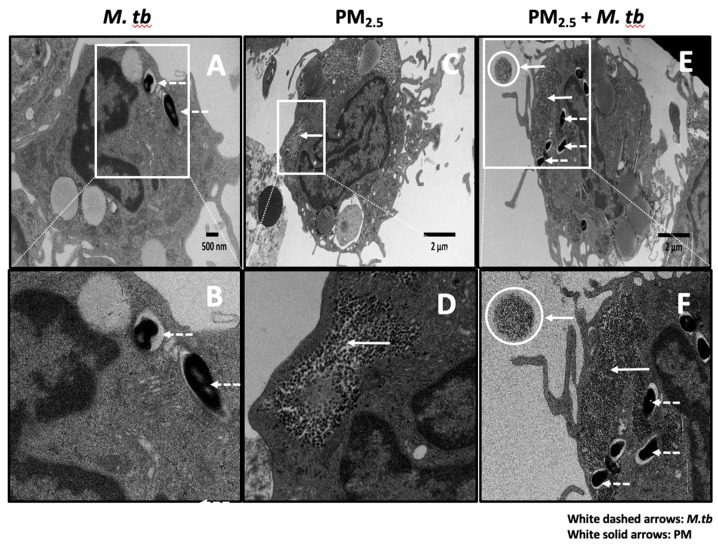
Figure 1.
Transmission electron microscopy (TEM) of PM2.5 and Mycobacterium tuberculosis (M.tb) uptake in human peripheral blood monocytes. (A,B) Endocytic vacuoles containing M.tb (white dashed arrows) showing uptake of multiple M.tb by a monocyte. (C,D) Monocyte containing air pollution PM2.5 (after 20 h exposure to 5 µg/mL PM2.5, white solid arrows). (E,F) Monocyte showing clusters of PM2.5 (white solid arrows, after 20 h exposure to 5 µg/mL PM2.5), and endocytic vacuoles containing M.tb (white dashed arrows, MOI 5) after M.tb infection for an additional 18 h. A free aggregate of PM2.5 (white circles) is visible extracellularly in panels E and F. Panels B, D, and F are zoomed images of panels A, C, and E respectively.

