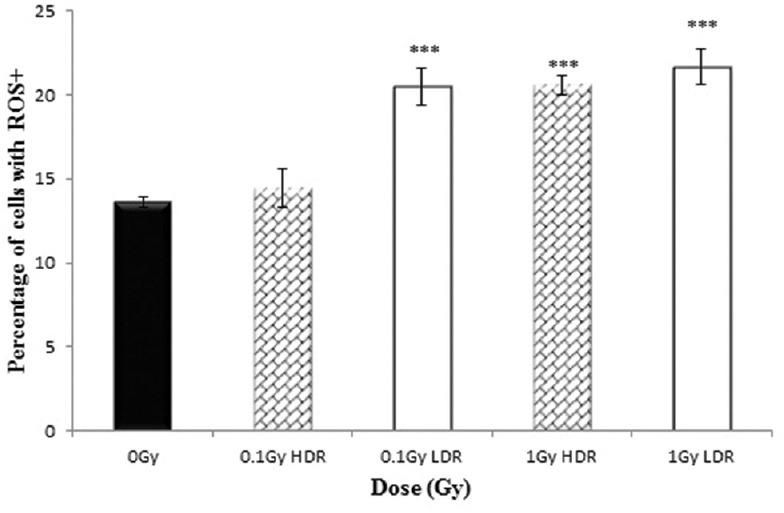
Figure 5.

Percentage of HF19 cells with ROS+ at 1.5 hours following x-ray irradiation at 0.1 and 1 Gy HDR and LDR. Combined data from three independent experiments. Error bars represent the standard error of the mean (SEM)

Percentage of HF19 cells with ROS+ at 1.5 hours following x-ray irradiation at 0.1 and 1 Gy HDR and LDR. Combined data from three independent experiments. Error bars represent the standard error of the mean (SEM)