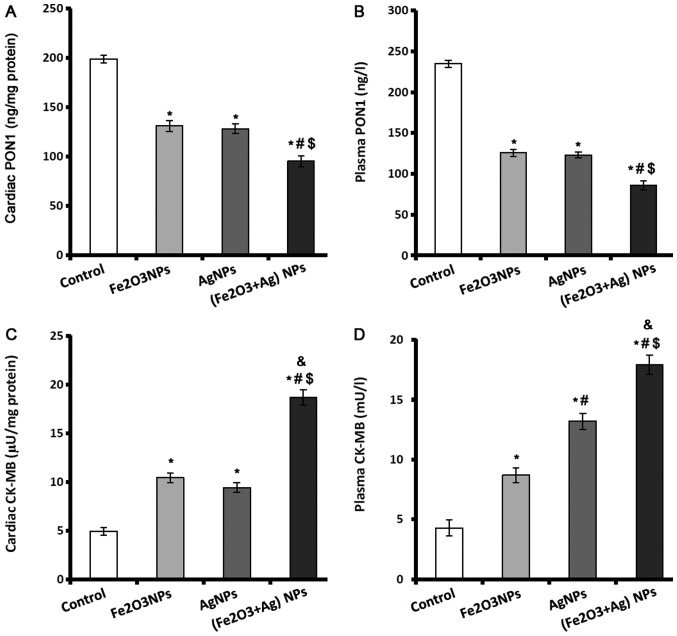
Figure 3.
PON1 and CK-MB levels in control, Fe2O3NP-exposed group, AgNP-exposed group, and Fe2O3NPs and AgNP-coexposed group. (A) Levels of PON1 in cardiac tissue and (B) in plasma. (C) Activity of CK-MB in cardiac tissues and (D) in plasma. *P<0.05 vs. control group; #P<0.05 vs. Fe2O3NPs exposed group; $P<0.05 vs. AgNPs exposed group; &P<0.05 synergistic interactions when both NPs are combined using Factorial Design. PON1, paraoxonase; CK-MB, creatine kinase-muscle/brain; Fe2O3NP, iron oxide nanoparticle; AgNP, silver nanoparticle.

