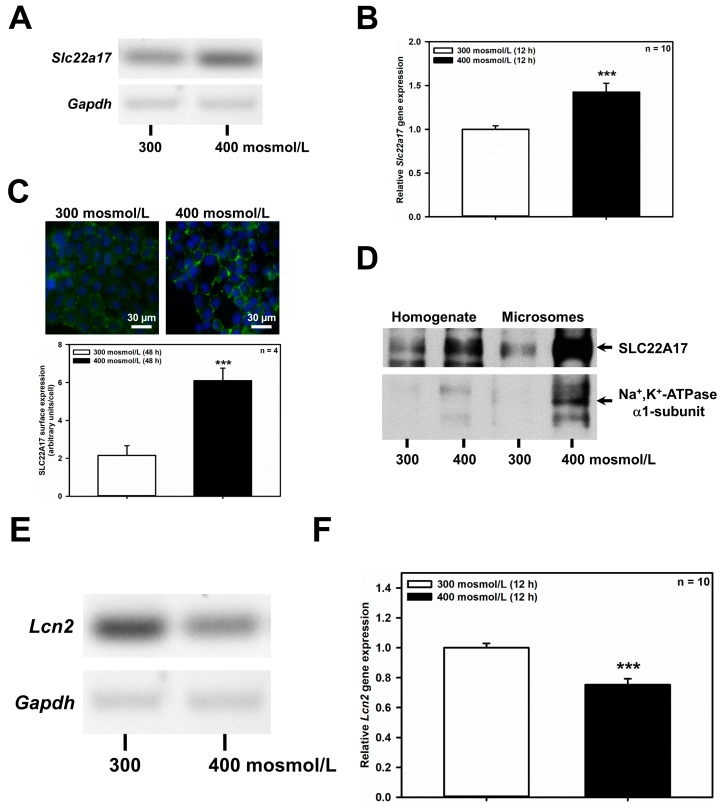
Figure 1.
Hyperosmolarity increases Slc22a17/SLC22A17 expression and decreases Lcn2 expression in mCCD(cl.1) cells. (A) RT-PCR analysis of Slc22a17 and Gapdh mRNA in mCCD(cl.1) cells exposed to 300 mosmol/L (normosmolarity) or 400 mosmol/L (hyperosmolarity) for 12 h. The experiment is similar to three others. (B) Expression levels of Slc22a17 mRNA by qPCR in mCCD(cl.1) cells exposed to norm- or hyperosmotic media for 12 h. Means ± SEM of 10 experiments are shown. Data normalized to the expression of Gapdh and Actb show relative expression levels of Slc22a17 under hyperosmotic conditions, where expression at 300 mosmol/L is set to 1.0. Statistics compare hyper- to normosmolarity by unpaired t-test. (C) Surface expression of SLC22A17 in mCCD(cl.1) cells exposed to norm- or hyperosmotic media for 48 h. SLC22A17 is detected by live immunofluorescence microscopy of non-fixed and non-permeabilized cells with a SLC22A17 antibody directed against the extracellular N-terminus. Hoechst 33342 counterstains nuclei. Means ± SEM of four experiments and comparison of the two osmotic conditions by unpaired t-test are shown. a.u. = arbitrary units. (D) Immunoblotting of homogenate and microsomes enriched in plasma membranes from mCCD(cl.1) cells grown for 72 h in norm- or hyperosmotic media. SLC22A17 is at the expected molecular mass of ~62 kDa. The α1-subunit of Na+, K+-ATPase, a plasma membrane marker, is enriched in microsomes and upregulated in cells exposed to hyperosmolarity. The experiment is representative of three similar ones. (E) RT-PCR analysis of Lcn2 and Gapdh mRNA in mCCD(cl.1) cells exposed to 300–400 mosmol/L media for 12 h. The experiment is typical of three similar ones. (F) Expression levels of Lcn2 mRNA by qPCR in mCCD(cl.1) cells exposed to 300–400 mosmol/L media for 12 h. Means ± SEM of 10 experiments are shown. Data normalized to the expression of Gapdh and Actb show relative expression levels of Lcn2 under hyperosmotic conditions, where expression at 300 mosmol/L is set to 1.0. Statistics compare the two osmotic conditions by unpaired t-test. For a definition of asterisks, see “statistics” in the Methods.

