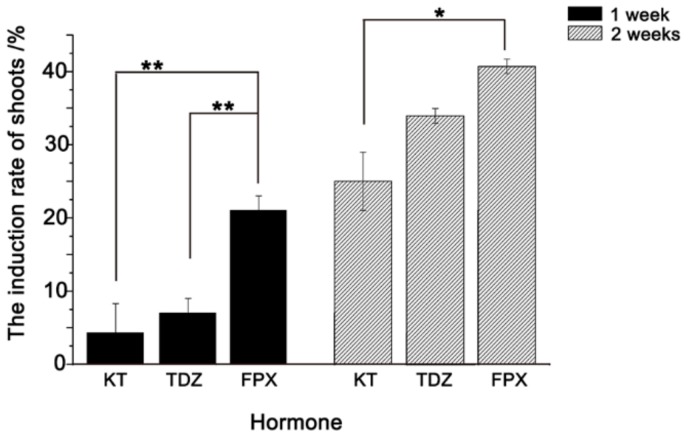
Figure 2.
Comparative analysis of shoot induction between KT, TDZ, and FPX. The induction rates of shoots were counted after one and two weeks culturing. The black bar and gray bar represent the induction efficiency of shoots under different hormones after one and two weeks, respectively. For each treatment, three replicates were conducted. The results indicated that significant differences were found between FPX and the other two chemicals of KT and TDZ after one-week growth. After two weeks, significant difference was found between FPX and KT treatments. Error bars represent ± SE, n = 3. Asterisk indicates significant difference relative to FPX (Student’s t test, * p < 0.05 and ** p < 0.01).

