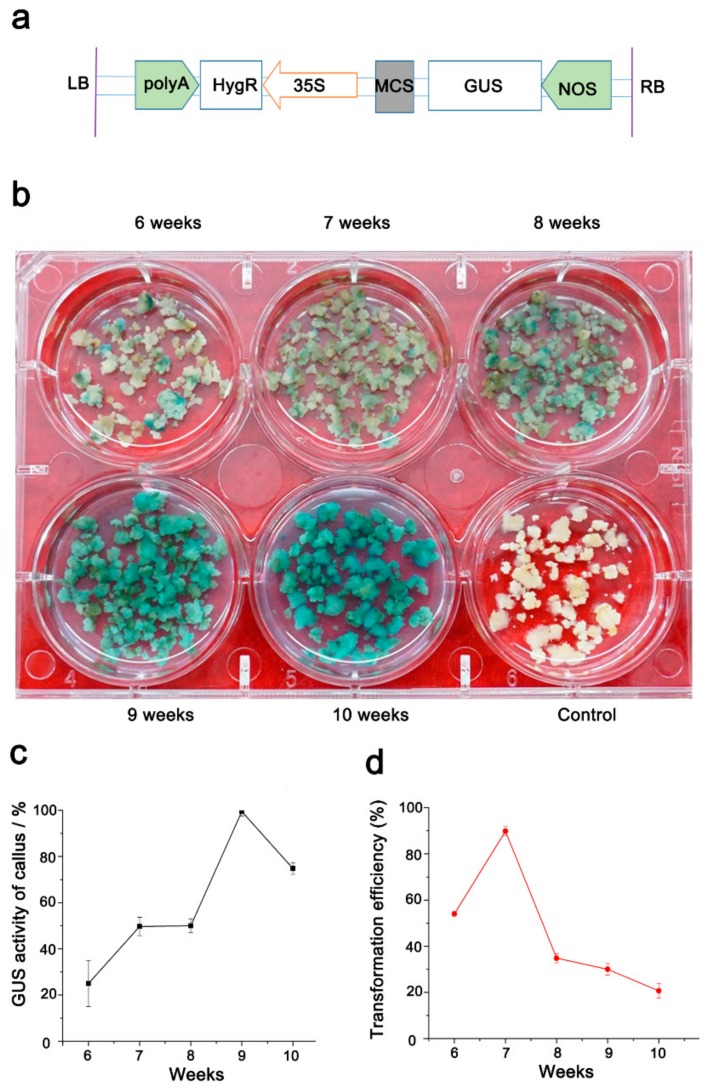
Figure 4.
The β-glucuronidase (GUS) activity and transformation efficiency in calli of different ages. (a). Schematic diagram of the T-DNA region of the binary vector pCAMBIA1391; LB: left border, RB: right border, polyA-CaMV: polyA signal, HygR: encoding hygromycin B phosphotransferase, 35S: CaMV35S enhance promoter, MCS: multiple cloning site, GUS: encoding β-glucuronidase, NOS-nopaline synthase terminator. (b). The GUS activity examination of calli with different ages. (c and d). Statistical analyses of the GUS activity in callus from different weeks (c) and the final transformation efficiency (d). For each treatment, three replicates were conducted. Error bars represent ± SE, n = 3.

