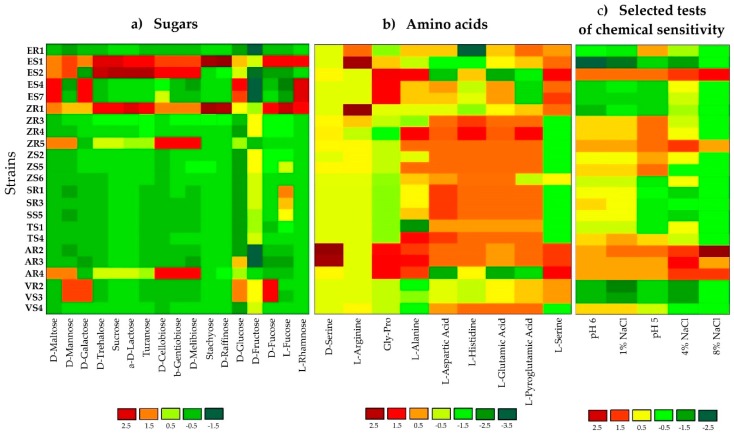
Figure 1.
Heatmap of 23 strains showing physiological profiles for (a) sugars, (b) amino acids and (c) selected tests for chemical sensitivity after 120 h of incubation. The relative utilization of selected substrates is depicted by color intensity, based on the legend next to the figure. The highest consumption can be identified by a red color and the lowest consumption by a green color.

