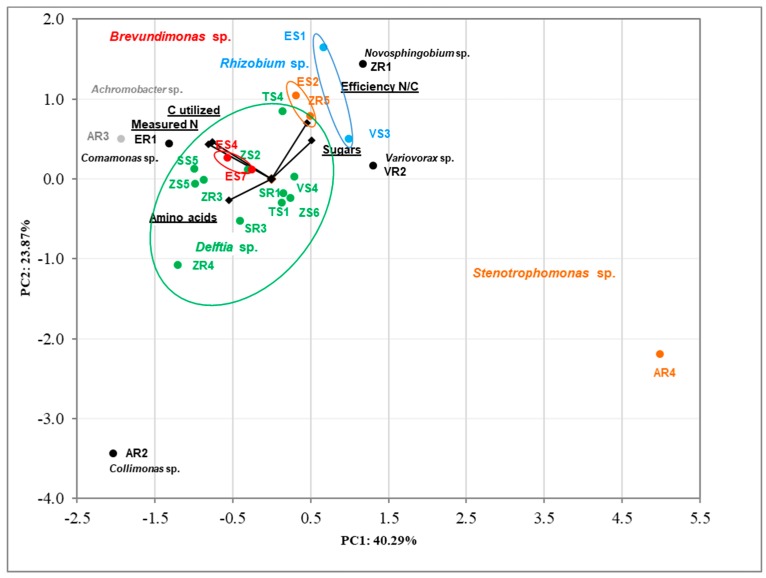
Figure 4.
Biplot diagram of Principal Component Analysis (PCA), describing amino acids and sugar utilization, efficiency of nitrogen fixation and nitrogen produced, carbon utilized for 23 bacterial endophytes isolated from plants. Strains classified based on the nucleotide sequence of their 16S rRNA genes to the same genus are indicated in different colors.

