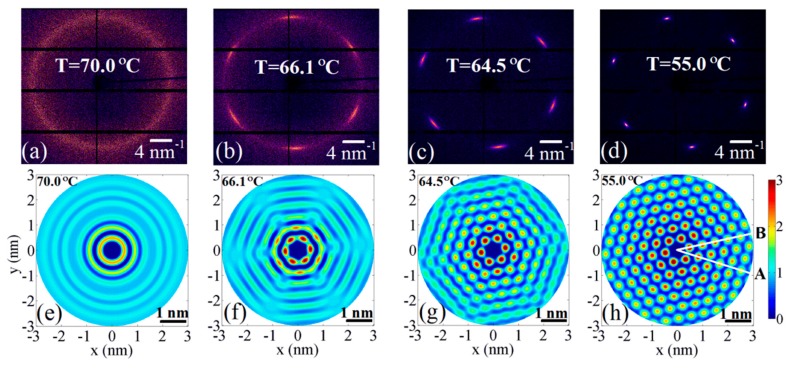
Figure 11.
(a–d) Measured diffraction patterns from 3(10)OBC LC compound above (a) and below (b–d) the Sm-A–Hex-B phase transition. (e–h) Corresponding reconstruction of the 2D pair distribution function (PDF). Development of the BO order and increase of the positional correlation length is visible in (f–h). (adopted from Zaluzhnyy et al. [76]). Reproduced with permission of American Physical Society.

