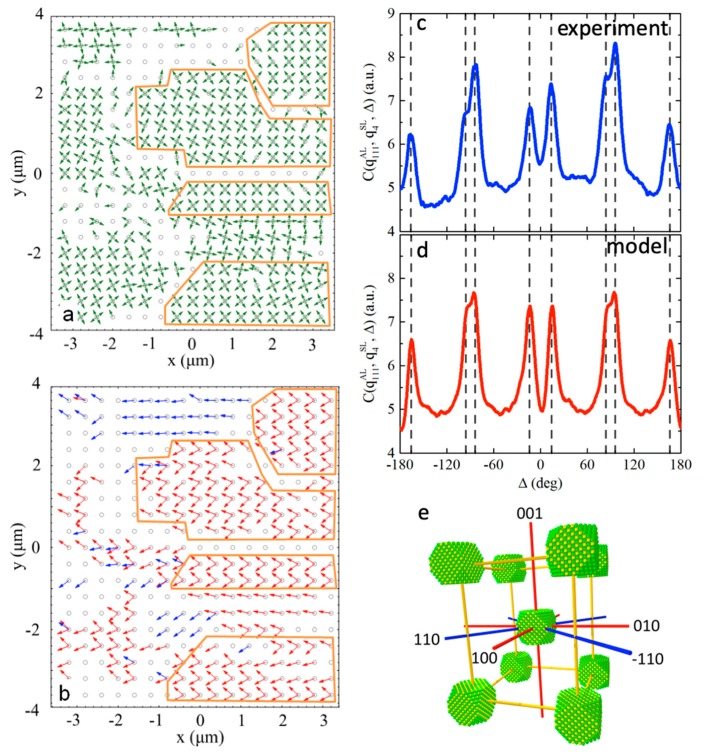
Figure 16.
(a,b) Spatially resolved maps, showing the angular positions of the {112}SL reflections of the superlattice (green arrows in (a)); {111}AL and {200}AL reflections of the atomic lattice (red and blue arrows in (b); respectively). Single-crystalline domains with a persistent orientation of PbS particles with respect to the superlattice are marked in orange; (c,d) Experimentally measured (c) and modelled (d) cross-correlation functions are shown by blue and red color, respectively; (e) Schematic of the mesocrystal unit cell displaying the angular correlation between the atomic lattice (AL) and superlattice (SL); collinear axes are indicated in red (〈100〉 directions) and blue (〈110〉 directions) (Adapted with permission from Zaluzhnyy et al. [18]. Copyright (2017) American Chemical Society).

