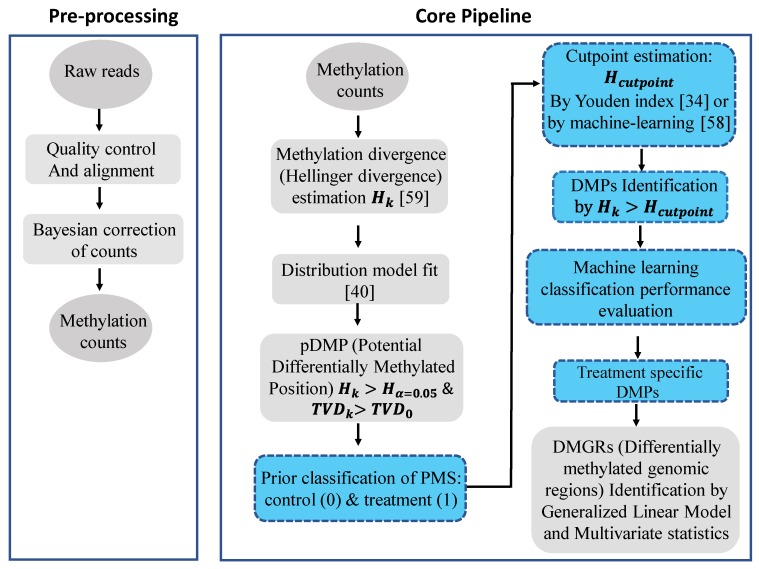
Figure 2.
Flow diagram of the signal detection and machine learning approach applied in our methylation analysis study. The approach is implemented in the R package Methyl-IT, which is available at GitHub: https://github.com/genomaths/MethylIT. Ovals represent input and output data, squares represent processing steps, with signal detection processing and machine learning steps highlighted in blue. For the machine learning classification performance evaluation, data from independent individuals in the same population are preferred. The final step shown (DMGRs) is not included in the current study, but is an analytical step that can be accomplished with Methyl-IT. Related references are cited accordingly for each key step.

