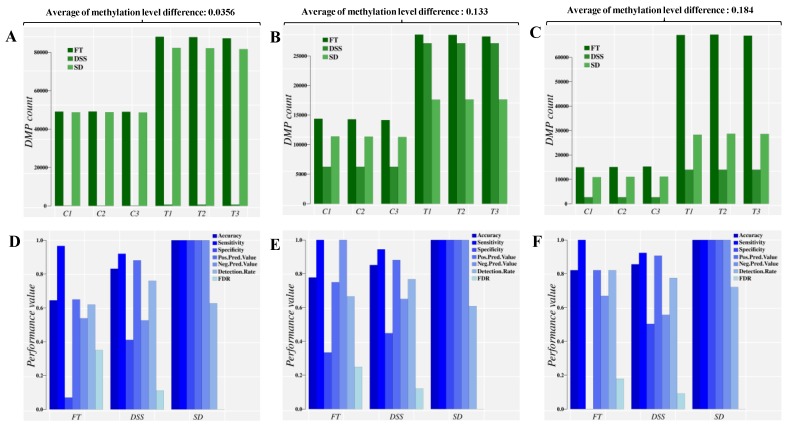
Figure 3.
Direct comparison of the classification performance for control and treatment DMPs based on three different approaches and at three different averages of absolute methylation level differences (mild difference, 0.0356, medium difference, 0.133 and large difference, 0.184). Panels (A–C) report the sum of DMPs detected, while panels (D–F) report the sum of main classifier performance indicators. An extended list of performance indicators is given in the supplementary information. C1-C3: control individuals. T1–T3: Treatment individuals. FT: Fisher’s exact test, used by methylKit [15]. DSS: An R package that uses generalized linear regression and Wald Test in the DMP identification [13]. SD: Signal detection approach, implemented in Methyl-IT.

