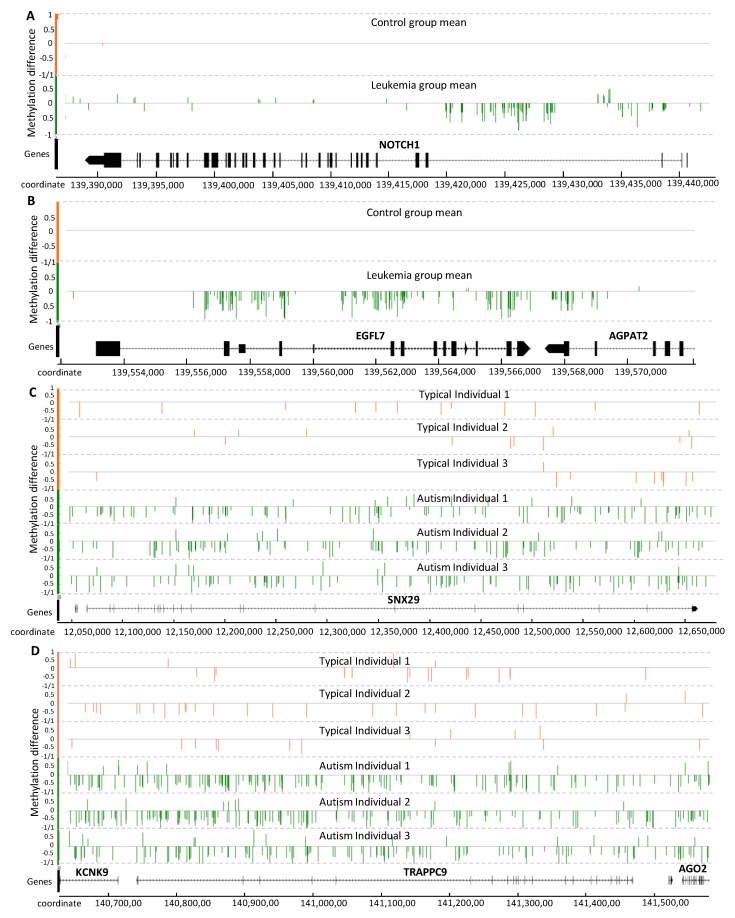
Figure 5.
Distribution of the methylation signal on gene-body for seven relevant genes reported to be associated with PALL (A,B) and autism (C,D). Methylation level difference at each cytosine is computed by (mC/(mC + uC))each individual − (mC/(mC +uC)average of all reference individuals, with mC and uC denoting the numbers of methylated and unmethylated reads, respectively. Each cytosine is represented by one single vertical line. The Integrated Genome Browser (version 9.0.2) was used to generate this figure.

