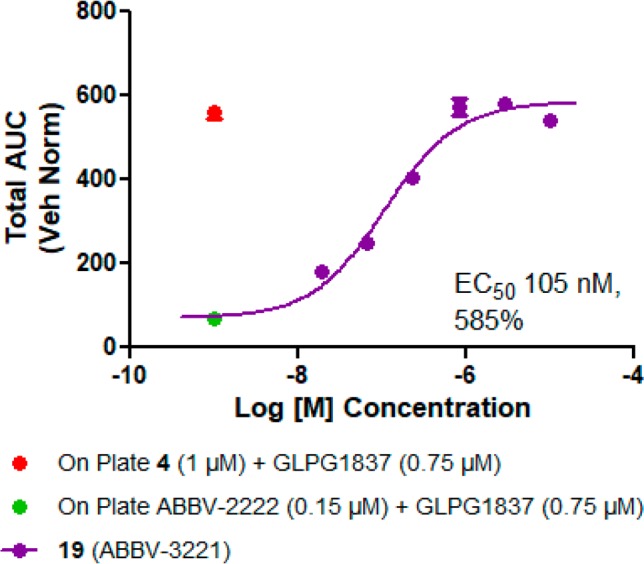
Figure 2.

Dose–response graph for 19 in triple combination format. The data are a combination from two separate experiments run on different days with cells from one CF donor with homozygous F508delCFTR mutation, with n = 3 replicates at each concentration.
