Figure 7.

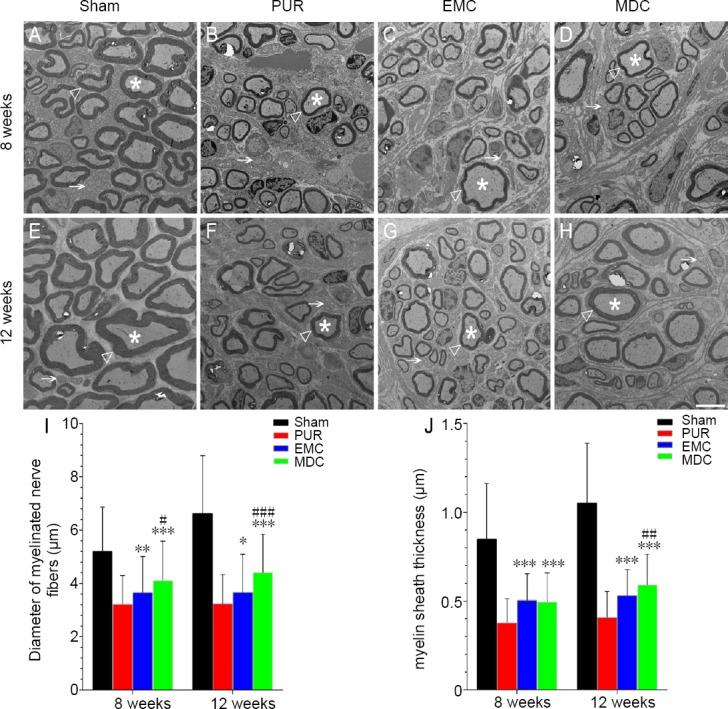
Transmission electron microscopy and morphological evaluation of nerve regeneration at 8 and 12 weeks post-surgery.
(A, E) Sham group; (B, F) PUR group; (C, G) EMC group; (D, H) MDC group. Scale bar: 5 μm. White triangle: myelin sheath; white star: myelinated nerve fibers; white arrow: unmyelinated nerve fibers. Diameter (I) and myelin sheath thickness (J) of myelinated nerve fibers were quantitatively assessed and statistically analyzed. *P < 0.05, **P < 0.01, ***P < 0.001, vs. PUR group; #P < 0.05, ##P < 0.01, ###P < 0.001, vs. EMC group. Data are expressed as the mean ± SD (number of myelinated nerve fibers from each group: > 100; one-way analysis of variance followed by Bonferroni post hoc test). EMC: External oblique muscle-fabricated nerve conduit; MDC: muscle-derived cell; PUR: polyurethane; Sham: sham-operated.
