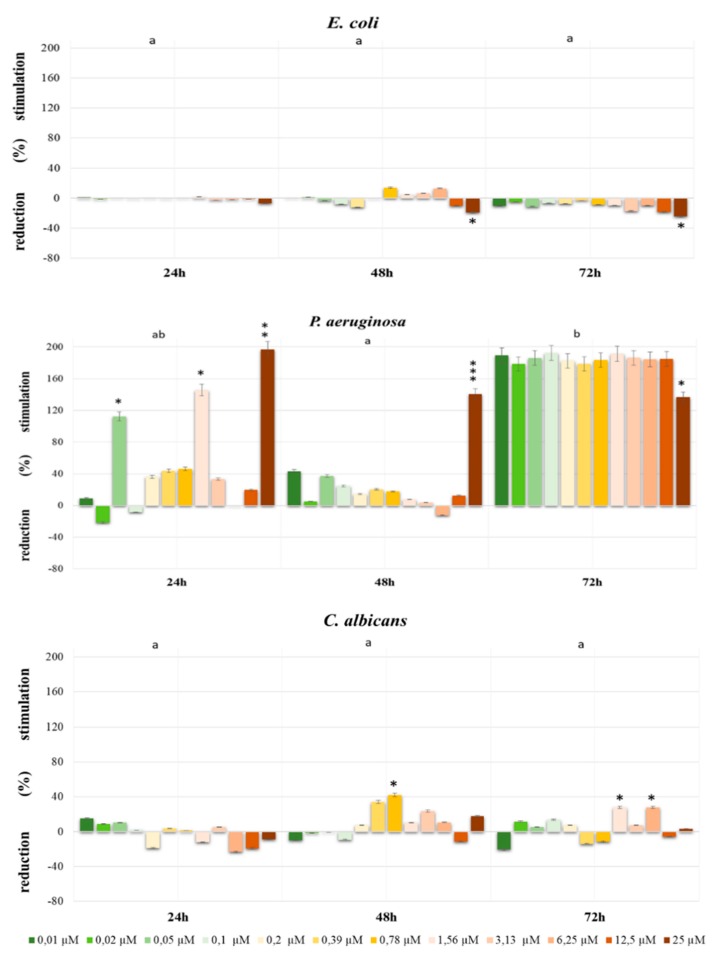
Figure 2.
The growth stimulation/reduction of E. coli, P. aeruginosa and C. albicans exposed to Dichlobenil for 24 h, 48 h and 72 h calculated as a percentage of control. The different letters indicate significant statistical differences (p ≤ 0.05) between each time of incubation estimated by Tukey’s test. *—p < 0.05, **—p < 0.01, ***—p < 0.001 represent significant effects between treatments and control were assessed by Dunnett test.

