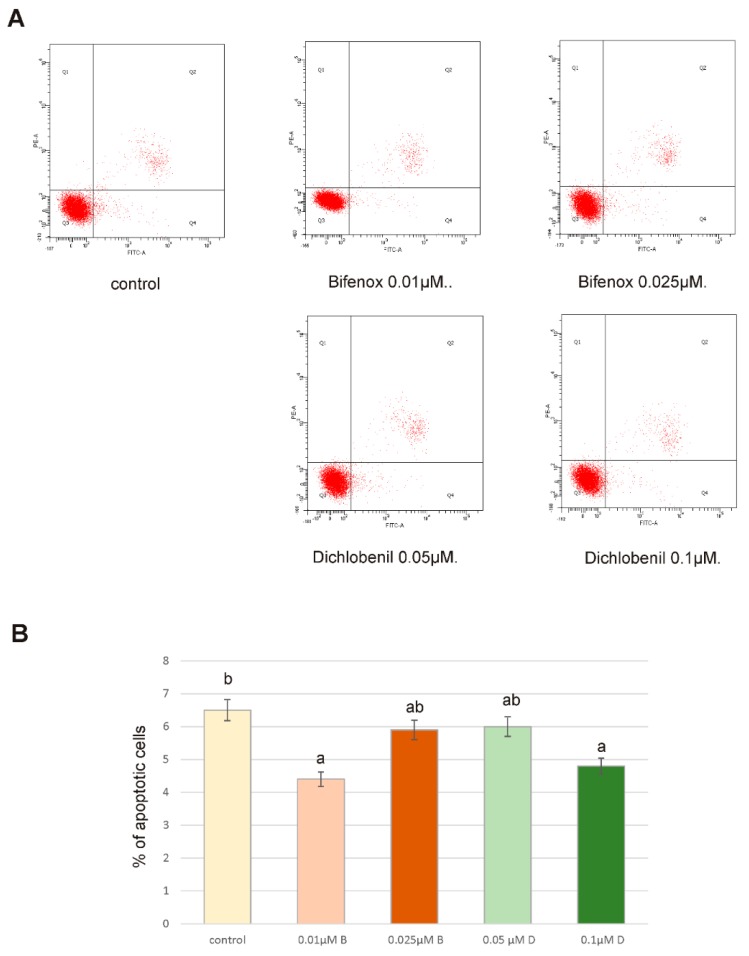
Figure 4.
The effect of Bifenox and Dichlobenil on apoptosis of ZR-75-1 cells. The cells were incubated with 0.01 µM B, 0.025 µM B, 0.05 µM D and 0.1 µM D, for 24 h. Representative dot plotes for 24 h treatment cells subjected to Annexin V-FITC/propidium iodide (PI) staining are shown (A). Bar graphs presenting the percentage of apoptotic (B) cells are demonstrated. Mean values from three independent experiments ± SD are shown. Different letters (a,b) indicate statistical differences (p ≤ 0.05) between control, Bifenox treatment and Dichlobenil treatment estimated by Tukey’s test.

