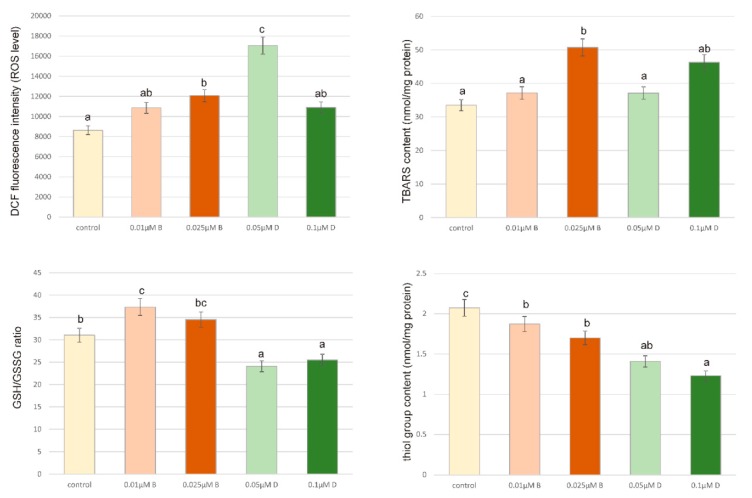
Figure 5.
The effect of Bifenox (B) and Dichlobenil (D) on the level of intracellular ROS, GSH/GSSG ratio, TBARS content and SH group content in ZR-75-1 cells. The cells were incubated with 0.01 µM B, 0.025 µM B, 0.05 µM D and 0.1 µM D, for 24 h. Mean values from three independent experiments ± SEM are shown. Different letters indicate statistical differences (p ≤ 0.05) between each treatment estimated by Tukey’s test.

