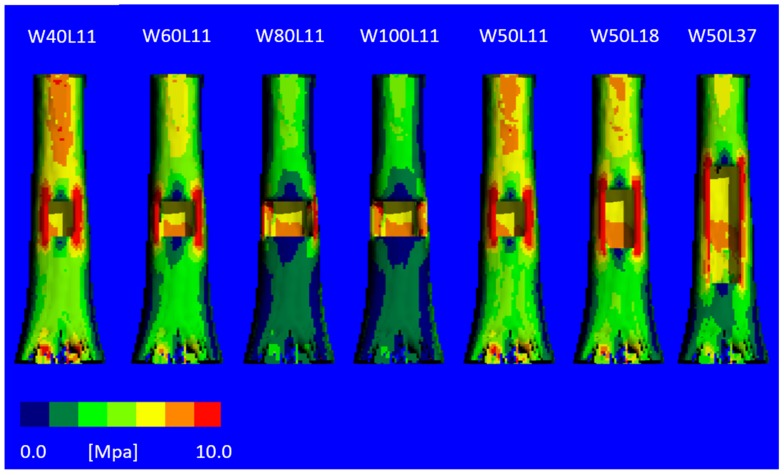
Figure 6.
The von Mises stress distribution for virtually created cortical defects with varying sizes, for one of the bone samples. With an increasing width of the defect, the high stresses are more concentrated in the corners of the defects. Defects 3 and 4 show low stresses below the defect and high stresses in small areas, whereas the narrow defects show a more homogeneous distribution of the stresses.

