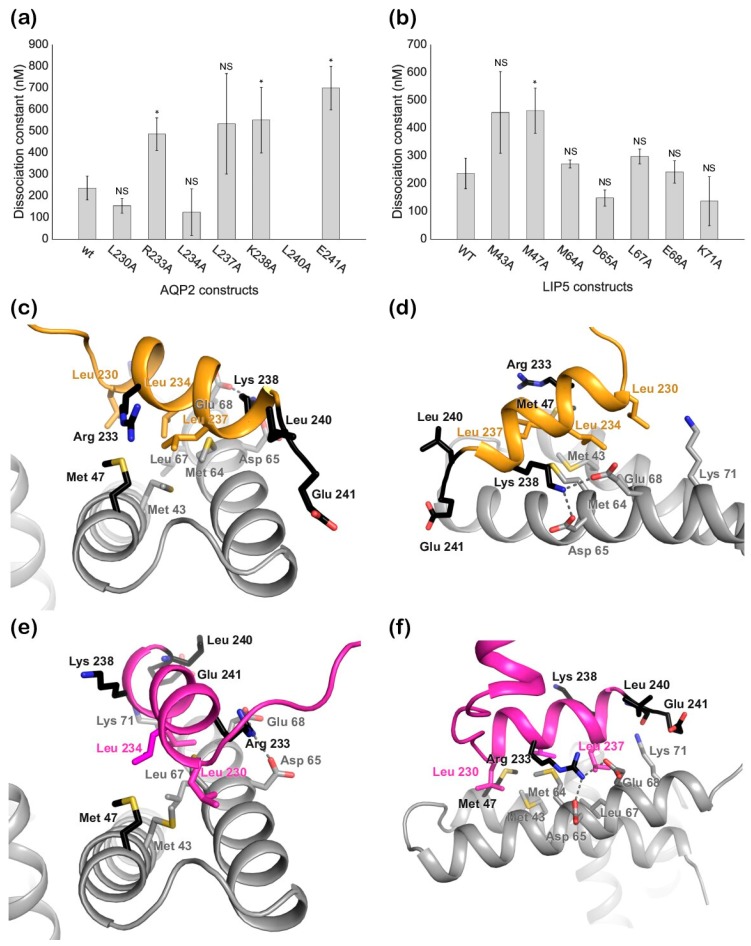
Figure 5.
Mutational analysis of the best HADDOCK docking solutions. Bar charts showing the dissociation constants (Kd) for the interaction between (a) LIP5 and AQP2 wild-type/mutants and (b) AQP2 and LIP5 wild-type/mutants. * indicates p < 0.05 (n = 3), NS indicates no significance; (c,d) structural representation of the interaction sites in cluster 2; (e,f) Structural representation of the interaction sites in cluster 3. Mutated residues which lower the affinity of the interaction or abolish it completely are shown in black. All residues that were probed by mutation are shown in stick representation. Predicted hydrogen bonds are depicted as dotted lines.

