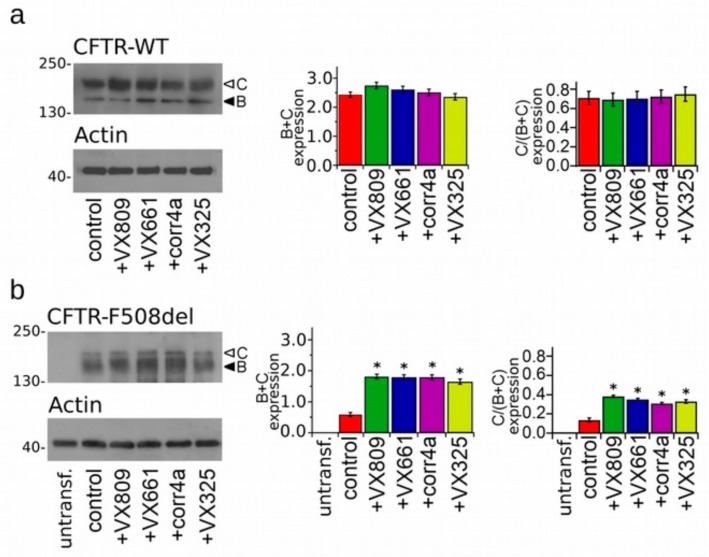
Figure 1.
Detection of full-length cystic fibrosis transmembrane conductance regulator (CFTR) proteins. (a) Western blot showing the wild type (WT)-CFTR in lysates of transiently transfected human embryonic kidney 293 (HEK-t) cells treated with DMSO (control), lumacaftor (VX809), tezacaftor (VX661), corr4a, and VX325. (b) Expression of the phenylalanine at position 508 (F508del)-CFTR in untransfected (untransf.) and in transiently transfected HEK-t whole cell lysates treated with DMSO (control), VX809, VX661, corr4a and VX325. The expression of the housekeeper protein actin in the same samples of (a,b) is shown in the lower panels. The molecular weight of the proteins of the molecular weight marker that was run in the SDS-PAGE is indicated on the left of each blot. White and black arrowheads indicate the position of the B and C bands, respectively. Bar graphs in the middle show the quantification of the total protein expression, calculated as the sum of the B and C band. Bar graphs on the right indicate the quantification of the mature, fully glycosylated fraction of the CFTR protein, expressed as a C/(C + B) band ratio. The expression level of each band was normalized to the level of actin detected in the same samples. Data are expressed as mean ± standard error of the mean (SEM) of at least four independent experiments. Statistical comparison of the data was made by a Dunnet multiple comparison test (all groups against the control group). Asterisks indicate a statistical significance versus the control: * p < 0.05.

