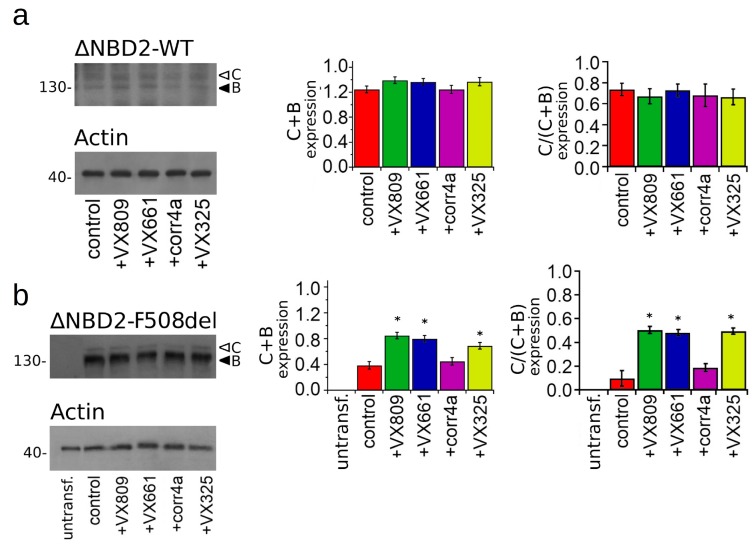
Figure 6.
Biochemical analysis of WT- and F508del-ΔNBD2 expression pattern. (a) Electrophoretic mobility of WT-ΔNBD2 in untreated HEK-t cells (control) or treated for 18 h with the VX809, VX661, corr4a and VX325 correctors. (b) Expression of F508del-ΔNBD2 in untransfected (untransf.) and transiently transfected cells after 18 h of treatment with DMSO (control) or with 5 µM VX809, 5 µM VX661, 10 µM corr4a and 5 µM VX325. Arrowheads indicate the fully-glycosylated (C band), the core-glycosylated (B band), and the unglycosylated, immature forms of the ΔNBD2 proteins. In the lower blots, the expression of actin, used as housekeeping protein, is shown. The molecular weight of the proteins of molecular weight marker that was run in the SDS-PAGE is indicated on the left of each blot. Bar graphs in the middle show the quantification of the total ΔNBD2 protein expression, calculated as the sum of the B and C bands, normalized by the actin expression. Bar graphs on the right indicate the quantification of the mature, fully glycosylated fraction of the ΔNBD2 protein, expressed as the C/(C + B) band ratio. Data are expressed as mean ± SEM of at least four independent experiments. Statistical significance was tested by Dunnet multiple comparisons test (all groups against the control group). Asterisks indicate statistical significance versus DMSO: * p < 0.05.

