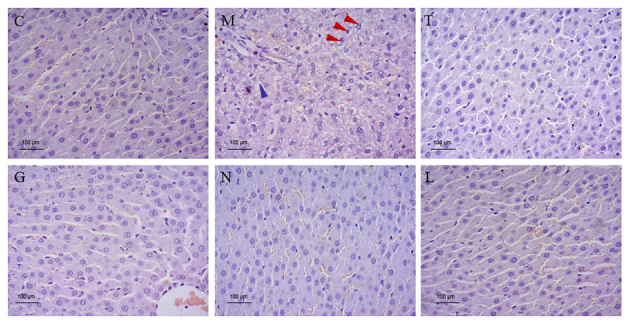
Figure 3.

Hepatic histopathological analysis of ALD rats following various probiotic and glutamine treatments. Representative photomicrographs following hematoxylin and eosin staining to observe the morphology of livers from different groups. Red arrows represented necrosis and inflammation and blue arrow represented fatty change. Scale bar, 100 µm. ALD, alcoholic liver disease; C, control group; M, ALD group; T, Golden Bifid treatment group; G, Glutamine treatment group; N, Medilac-S® treatment group; L, Golden Bifido and glutamine treatment group.
