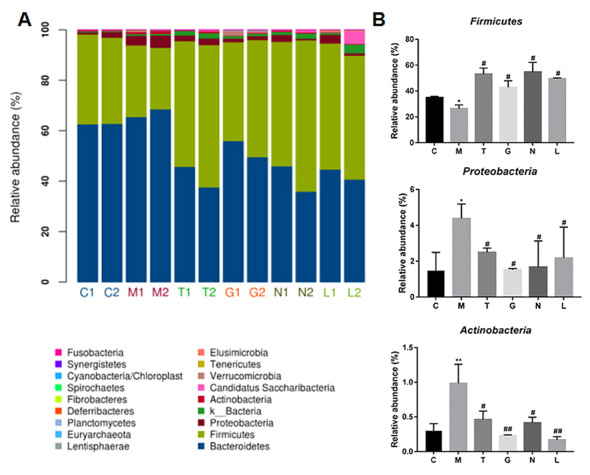
Figure 5.

Bacterial community structures at the phylum level. (A) The abundance of each bacteria genus is presented as the percentage of the total effective bacterial sequences in the sample. (B) The relative abundance of Firmicutes, Proteobacteria and Actinobacteria in each group. *P<0.05 and **P<0.05 vs. C group; #P<0.05 and ##P<0.01 vs. M group. C, control group; M, ALD group; T, Golden Bifid treatment group; G, Glutamine treatment group; N, Medilac-S® treatment group; L, Golden Bifido and glutamine treatment group.
